Want to know what is actually working on social right now? We got you.
We’ve investigated post volume, engagement rates, and content preferences across the big six platforms: Facebook, Instagram, LinkedIn, Twitter/X, TikTok, and YouTube to identify patterns that will help you create more resilient and adaptable social media strategies in 2024. And then put everything we learned into this handy dandy State of Community Management Report. (Don’t worry – you can thank us later.)
What You’ll Learn in the State of Community Management Report
We analyzed the data from over 21 million social media posts to uncover key insights like:
- The types of content, hashtags, and emojis that perform best
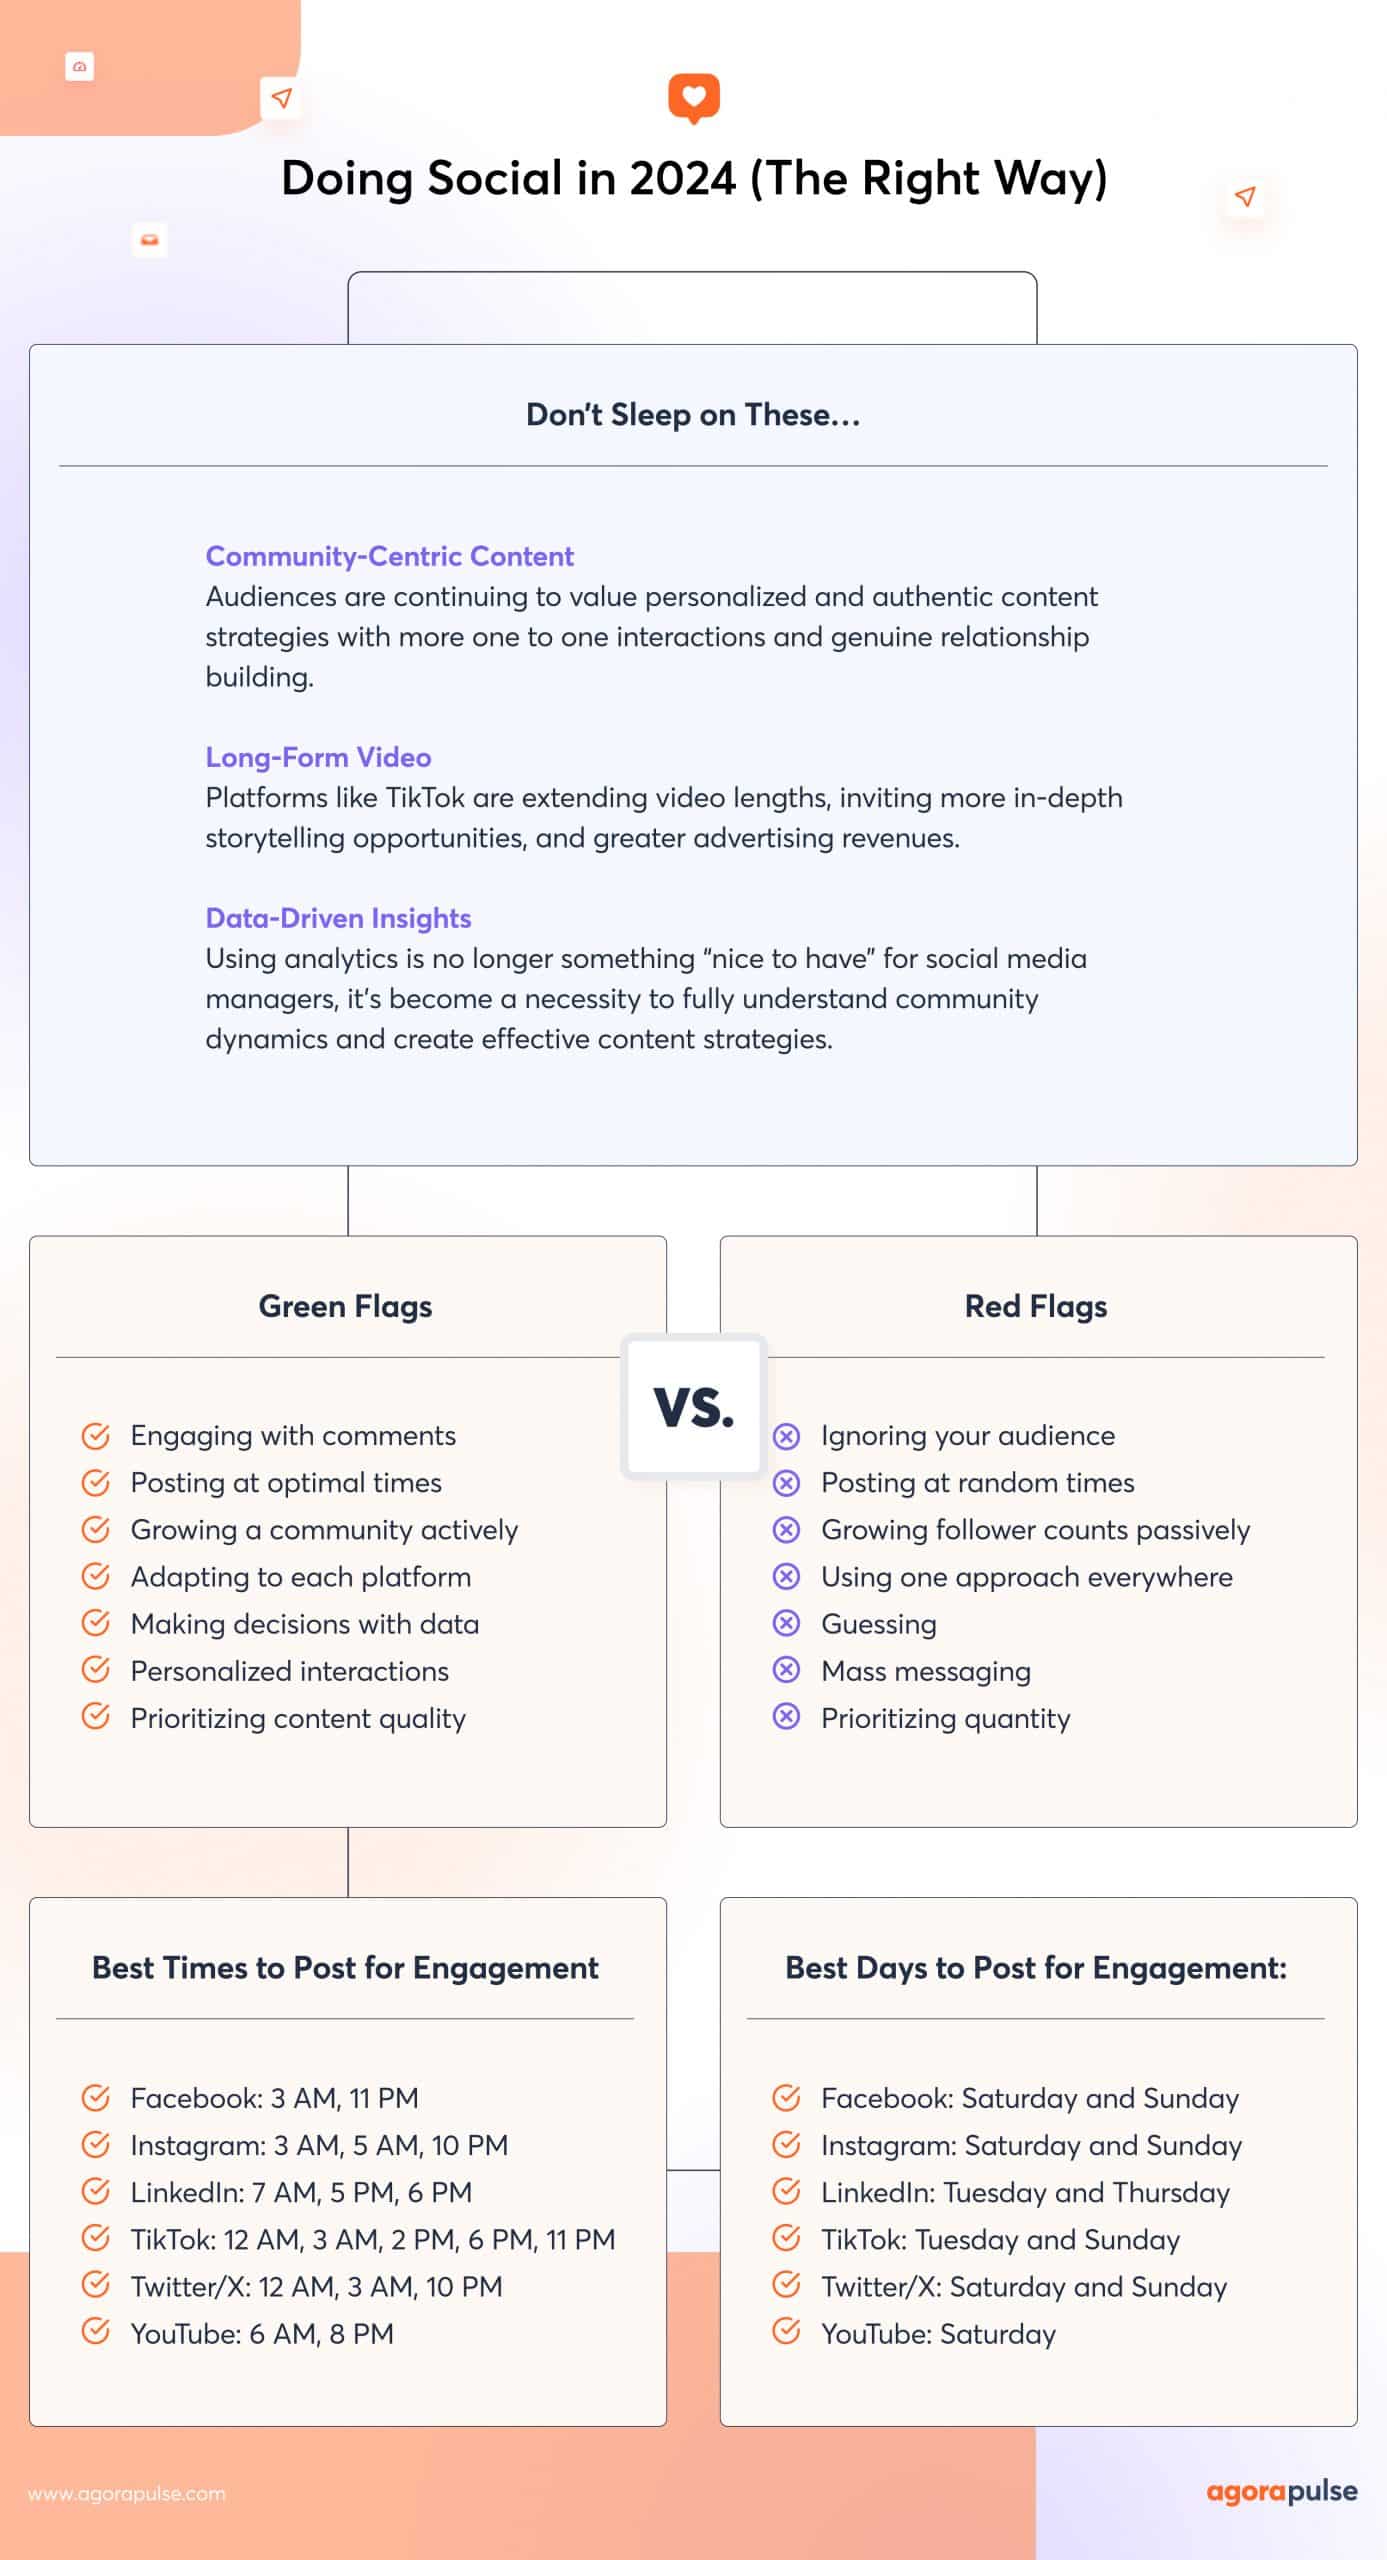
- The best time to post on each platform for more engagement
- The top emerging trends in community management that will improve your strategy
Plus, find out the #1 reason social media managers are shifting their focus towards authentic community engagement to drive meaningful results on social.
So if you want actionable insights that will help you build and grow your audience on social media, then you’ve come to the right place.
Let this report be your guide to the intricacies of community management, where you’ll find the observations and strategies you need to manage social media with confidence and creativity.
Here’s a Preview of What’s Inside the Report…
Improve Your Publishing Strategy
This section focuses on publishing, and explores the volume of posts across different platforms, identifying trends that signal strategic implications for social media publishing strategies.
Post distribution overview
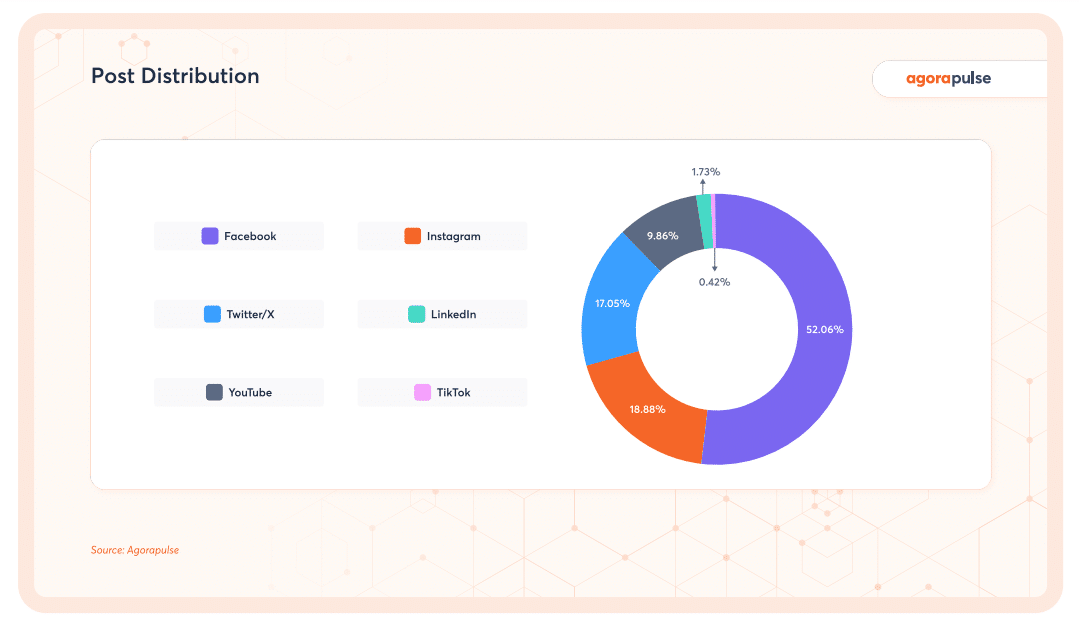
- Facebook dominated in terms of post distribution in 2023 capturing 52.06% of the total posts published through Agorapulse, showcasing the platform still plays a vital role in social media marketing strategies.
- Instagram and Twitter/X showed significant activity, with 18.88% and 17.05% of posts, highlighting their roles in engaging audiences and driving conversations.
- LinkedIn‘s 9.86% share reflected its niche but vital role in professional networking and content dissemination.
- YouTube and TikTok, despite their lower shares of posts published, underscored the growing importance of video content in engaging modern audiences.
Volume of posts published in 2023
- Facebook: Starting strong in January with nearly a million posts, Facebook saw a consistent flow of content throughout the year, peaking again in March. However, there was a noticeable dip in July, hinting at a summer slowdown before activity picked back up towards the year’s end.
- Instagram: The visual platform showed a steady increase in activity from the start of the year, peaking in June. Interestingly, there was a slight retreat during the summer months before regaining momentum in the fall, suggesting seasonal variations in user engagement.
- Twitter/X: The platform had a relatively stable volume of posts until July, coinciding with the platform being rebranded to X.
- LinkedIn: Demonstrating a consistent pattern, LinkedIn saw its highest activity in March, with a gradual decrease leading into the end of the year. This could reflect the professional audience’s engagement patterns, possibly aligning with fiscal quarters and vacation periods.
- YouTube: YouTube’s content volume steadily grew each month, reaching its zenith in November. This upward trend highlights the platform’s growing importance in content strategy, particularly towards the year’s end, likely capitalizing on holiday seasons and year-end summaries.
- TikTok: Starting with the lowest volume of posts among the platforms, TikTok saw a significant increase in activity in June and July, and peaked again in November.

Post Distribution (State of Community Management Report 2024)
D0 Social Media the Right Way [Infographic]
Like what you’ve read so far? There’s so much more to dig into regarding social media, such as engagement and content trends as well as the future of communities. Get the details about the state of community management: download our free report today.


