In her book “The Art of Asking”, Amanda Palmer mentions how she had two jobs. One scooping ice cream for $12.57/hour ($9.5/hour + tips) on a good tip day, the second job as a living statue where she made $38 in an hour.
Amanda realized she could earn more doing her second job, be her own boss, and make her own schedule.
It’s the same with Facebook ads- what gets measured gets managed. Measuring sub-audiences’ performances can help improve the results you get from your ads and make them more effective.
A common practice is to target broadly, then use Facebook custom ad reports breakdown to see which sub-audiences perform best and worst.
In this article, we’ll show you how to split test sub-audiences not accessible via Facebook’s custom ad reports breakdown and how this can improve your ad performances.
1) Split test Neighborhoods & zip codes
If you are an NYC rat exterminator, the Upper West Side is where your services are the most needed according to AddressReport- 681 rodent complaints compared to 34 in the Financial District.
Have a service aimed at divorce living in London? According to the book “The information capital” they tend to cluster around Tottenham.
Below is a real estate listing picture I took while visiting an upscale area of Hong Kong. Average household income does change based on the neighborhood.
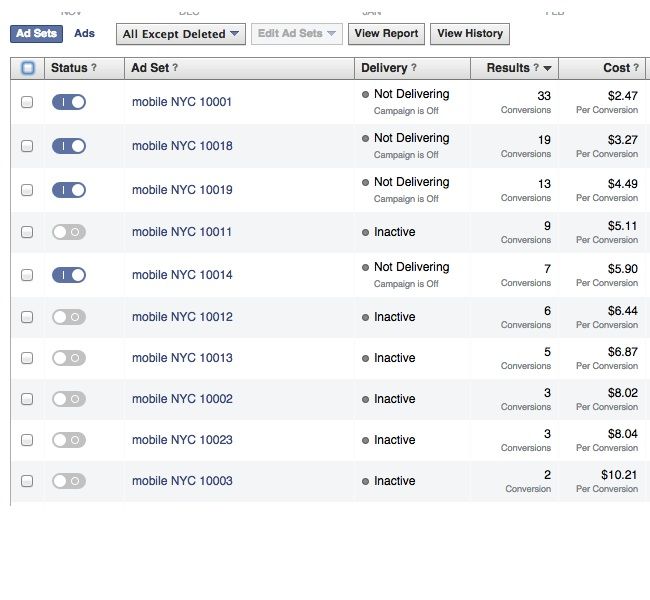
For a campaign promoting a permanent hair straightening in Manhattan, most leads came from 2 zip codes. With the best performing zip code bringing leads at five times less than the worst performing zip code.
Targeting by zip code used to be available to the US only, but Facebook expanded this to other countries earlier this year.
2) Split test interests
Nonstop, I see advertisers bundle multiple interests into a single ad set. Creating thousands of ads has taught me that some interests perform better than others.
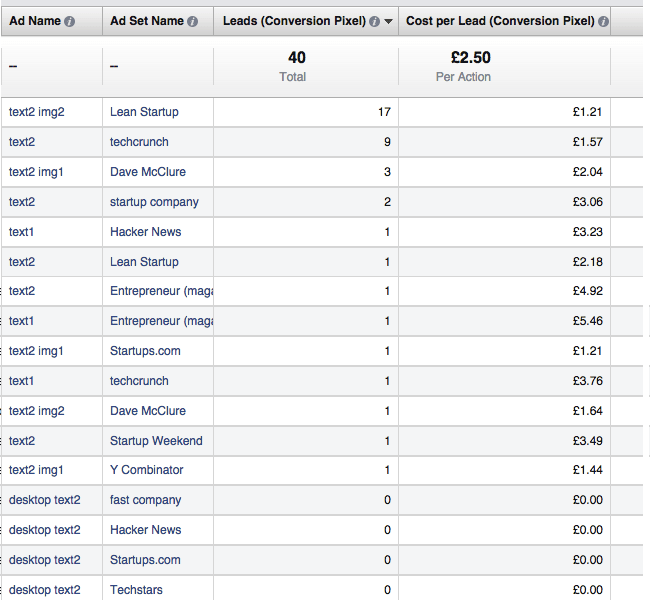
The ad below promoted an early version of a book about lean startups, with the aim of getting feedback from the London startup community.
Lean startups as an interest not only brought the most opt-ins, but also at the lowest cost.
3) Split test age
Have a campaign with both a high budget and high volume of impressions? It will likely make sense to split test your ads into age ranges smaller than decades.
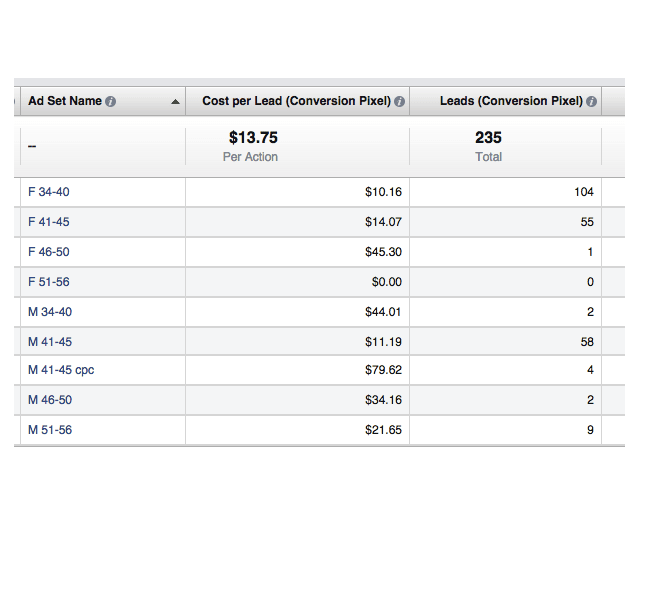
Not only are lead costs different for each age group, but the ad M 34-40 cost per lead is four times that of the ad M 41-45. These two would have been bundled as one age group in Facebook reports, and I never would have noticed the difference if I hadn’t separated them myself.
The same is true for ads F 34-40 and F 41-45. 41-45 is not only cheaper per lead, it generates more as well.
4) Split test cities
Have a campaign targeting a limited number of cities?
Split test each city into separate ad sets and you may find different performances for each.
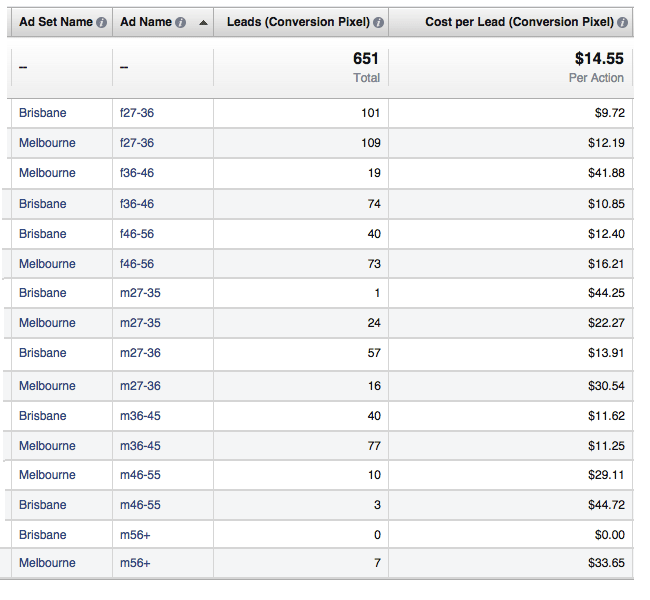
The example below was taken before Facebook introduced the new ad sets structures, so the ad set name presents the city of the ad, and the ad name the gender and age group.
Looking at the ad f36-46 we notice the cost per lead is four times higher in Melbourne, even when targeting the same gender and age group than Brisbane. Had I not split tested my ads, I wouldn’t have known.
It’s not only about the cost per action
It is not unusual to have a situation like this:
1st week:
Ad set1 average cost per fan is $0.49
Ad set2 average cost per fan is $0.61
2nd week:
Ad set1 average cost per fan is $0.99
Ad set2 average cost per fan is $0.69
Split testing allows to manage our campaigns, as performances tend to change with time.
What do you think? want to share you experience, or have a question, please do leave a comment, I read all comments.


