Run Facebook Ads? Then you’ll need to find a way to do reporting and keep your sanity.
If you run Facebook Ads, you must get a handle on reporting. When you monitor the right metrics, you can keep your ad performance on track and optimize campaigns to achieve even better outcomes—both of which are bound to make your boss happy.
But if you can’t make sense of Facebook Ads reports or if you don’t check metrics regularly, you can easily waste time, money, and resources. (All of which can quickly frustrate your clients.)
Fortunately, Facebook Ads reporting doesn’t have to be difficult, especially if you aren’t a data diva or a spreadsheet master.
Know Your Facebook Ads Metrics For Reporting
Before you can start analyzing the results from your Facebook Ads campaigns, you’ll want to understand some of the most common metrics.
Keep in mind that standard metrics like spend and impressions are relevant to almost any Facebook Ads campaign. In contrast, more specific metrics like leads and estimated ad recall lift only apply to campaigns with certain Facebook Ads objectives.
Standard Facebook Ads metrics
Monitoring these standard metrics can help you make sure your spending and return on investment (ROI) are on track:
- Clicks: The total number of times the link in your ad was clicked
- Click-through rate (CTR): How often a Facebook user clicked on your ad
- Cost per 1,000 impressions (CPM): The amount you had to spend for every 1,000 ad views
- Cost per click (CPC): The amount you had to spend for each click
- Impressions: The number of times your ad campaign has been viewed
- Reach: The number of Facebook users your ad campaign has reached
- Revenue: The revenue your ad campaign has generated via your e-commerce store
- Spend: The total amount your ad campaign has spent
Objective-specific Facebook Ads metrics
Tracking these Facebook Ads metrics can ensure that you’re making progress toward your campaign goals:
- Conversion events: The total number of times your ad initiated a sale or another predetermined conversion (applies to conversion campaigns)
- Estimated ad recall lift: The percentage of people who remember seeing your ad (applies to brand awareness campaigns)
- Event responses: The number of people who provided a positive response to your event invitation (applies to event responses campaigns)
- Leads: The number of completed contact forms your ad generated (applies to lead generation campaigns)
- Mobile app installs: The total number of people who installed your mobile app (applies to App Installs campaigns)
- New messaging conversations: The number of new conversations your ad initiated in Facebook Messenger (applies to Messages campaigns)
- Page likes: The number of new Facebook Page likes your brand received (applies to Page Like campaigns)
- Post engagement: The total number of reactions to your post (applies to Post Engagement campaigns)
- Store traffic: the number of people who visited your store after seeing your ad campaign (applies to Store Visits campaigns)
- Three-second video views: The number of people who viewed at least three seconds of your ad campaign’s video (applies to Video Views campaigns)
- Website conversions: the total number of sales from your e-commerce catalog (applies to Catalog Sales campaigns)
Make Your Reporting Easier With Agorapulse AdsReport
Whether you want a quick overview of the standard Facebook Ads metrics or you need to dig into the details of your campaign results, Agorapulse AdsReport can help. This free tool is designed to deliver the information you need to assess ad campaign costs and check high-impact metrics in seconds.
How to use AdsReport
Follow these steps to get the most out of this reporting tool.
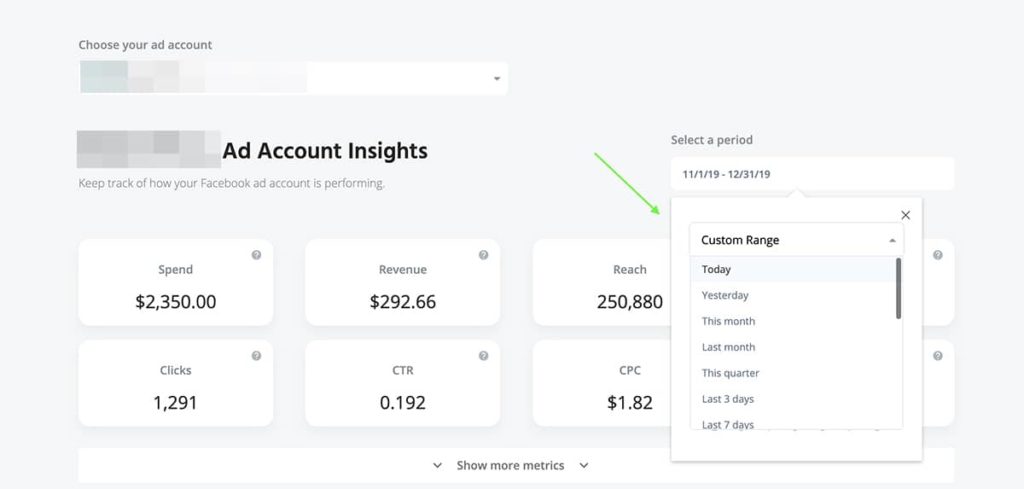
Select a time period
Pick standard settings like today or this month, or select a custom time frame.
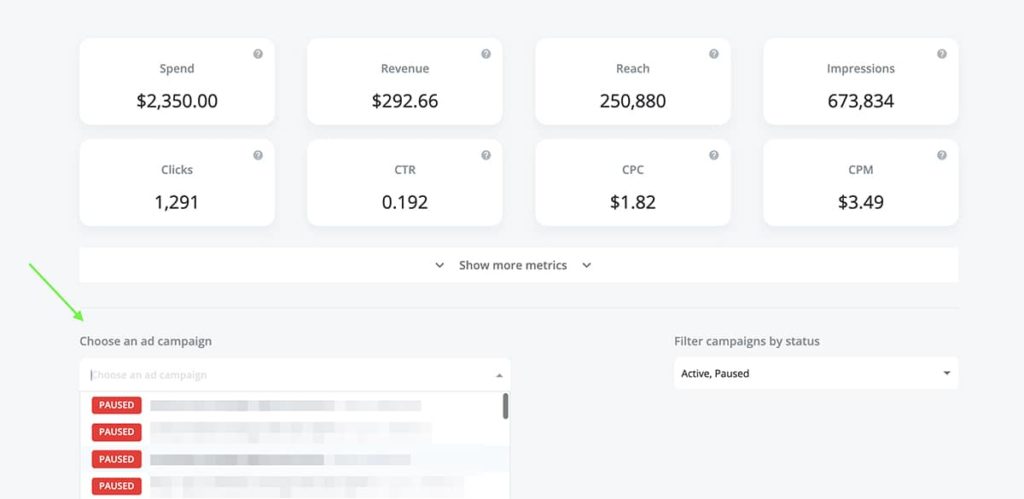
Choose an ad campaign
By default, the tool shows metrics for all campaigns during the time period you selected. If you want to hone in on a specific campaign, pick one to view individually.
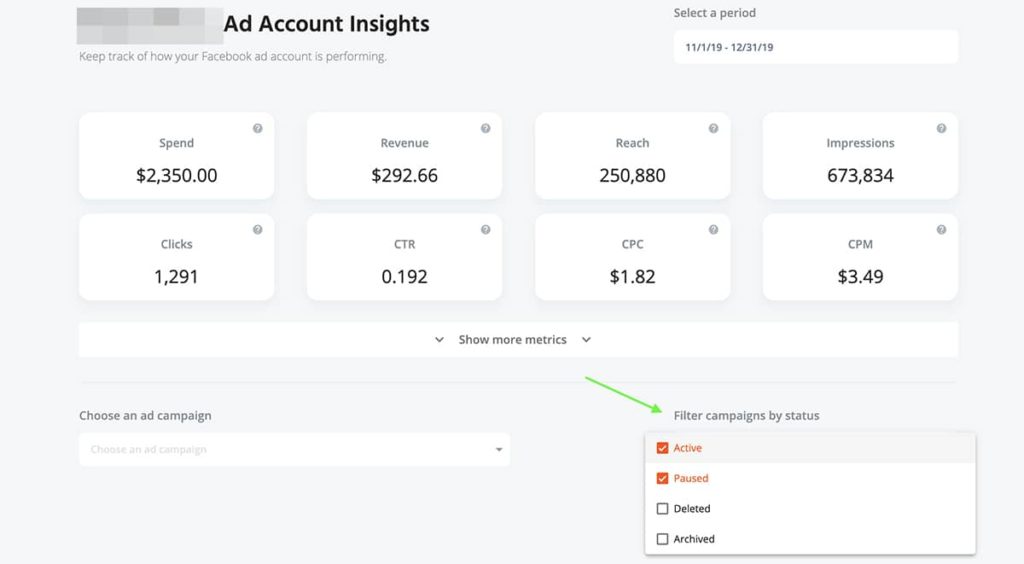
Filter by status
By default, the tool shows metrics for active and paused campaigns. You can filter by archived and deleted campaigns, too.
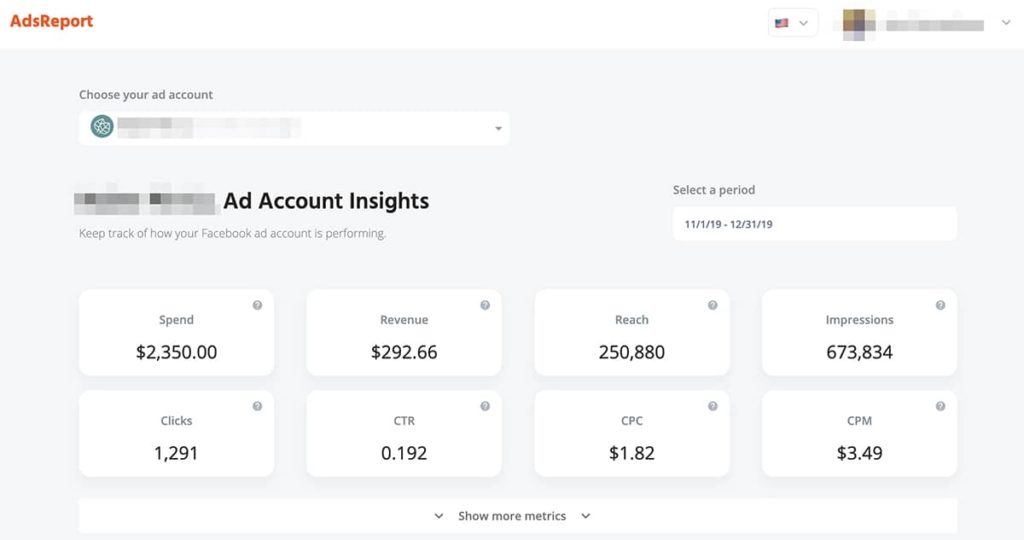
View standard metrics
Once you’ve selected parameters, you can view standard metrics, including spend, revenue, reach, impressions, clicks, CTR, CPC, and CPM.
Show more metrics
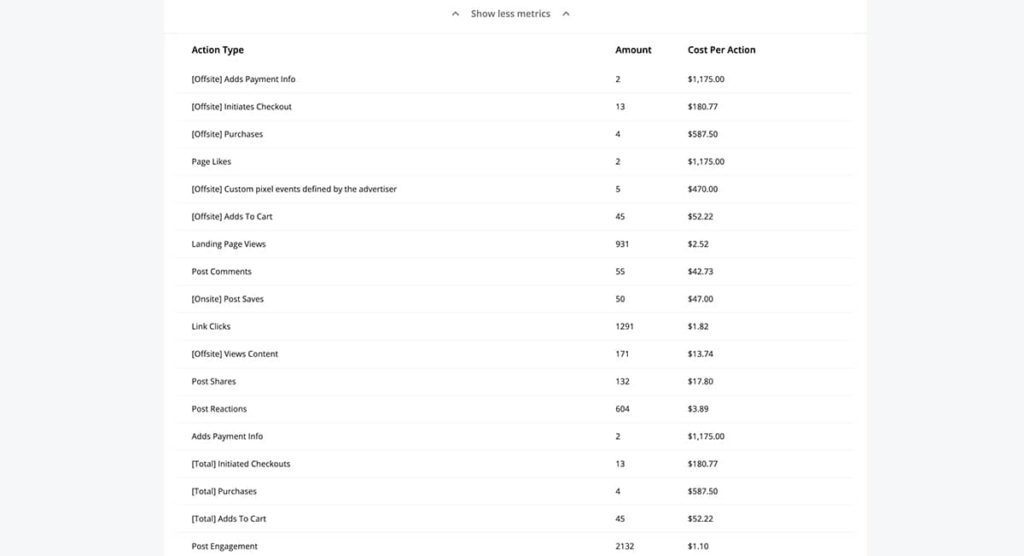
Why stop with the basics? You can also reveal additional metrics to learn about everything from post reactions and shares to landing page views and page likes to checkouts and purchases.
When you have this information at your fingertips, you can monitor progress, identify problems, and make improvements quickly.
You can also make decisions without wasting time digging through mountains of Facebook Ads data. That means your team can operate more efficiently.
Metrics like reach and impressions can help you determine whether you’re connecting with enough customers.
If those metrics don’t meet expectations, you can reevaluate your bid, review your creative, or reread your ad copy to improve results.
By troubleshooting your Facebook Ads, you can fix mistakes and resolve performance issues before they lead to major problems.
With a quick glance at your AdsReport, you can also make sure you’re spending your budget efficiently. If your CPC or CPM is too high, you can add a cost cap or adjust your audience to improve your Facebook Ads results.
Use Native Tools for In-Depth Reporting
Although Agorapulse AdsReport is ideal for streamlining your workflow, native tools can also improve your reporting process.
Default Facebook Ads reports
Once you’ve pressed play on your Facebook Ads campaign, you can track results with the platform’s native reporting tool.
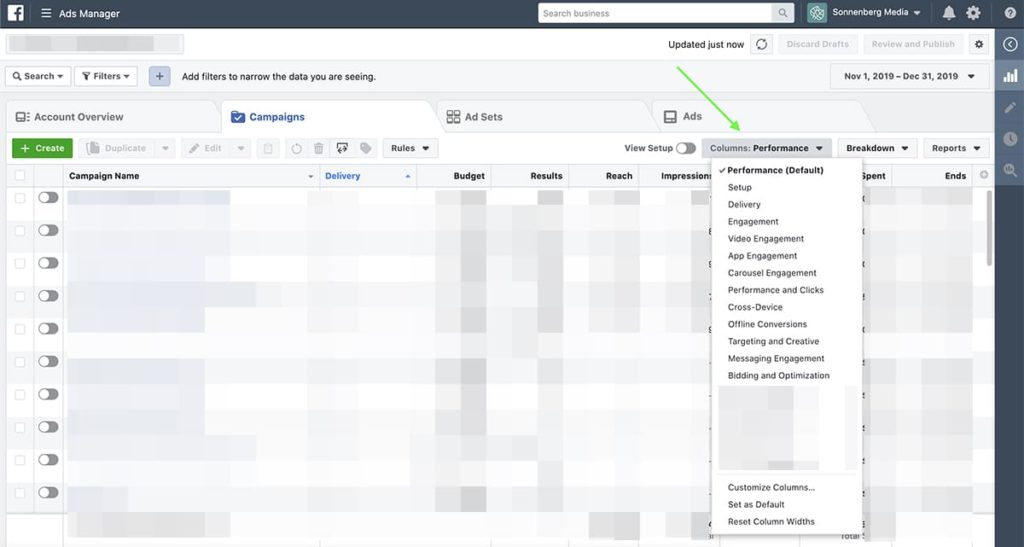
Facebook Ads Manager has about a dozen default report templates that help you track standard metrics like engagement, clicks, and targeting.
These reports are designed for campaigns with specific objectives.
That means they can help you gauge the most relevant metrics without overwhelming you with data that doesn’t apply to your campaign.
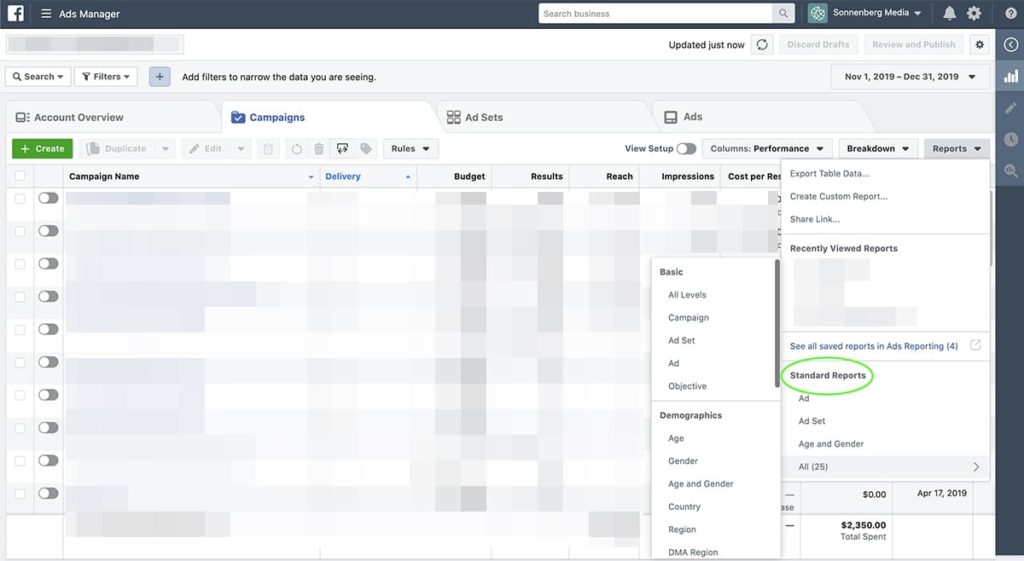
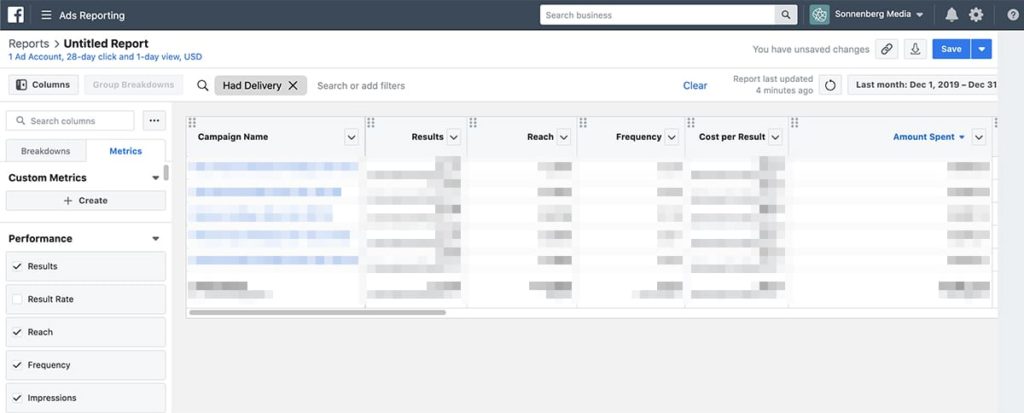
If you need more data related to your audience demographics or campaign delivery, head to the Facebook Ads Reporting portal.
Here, you can access more than two dozen default templates that make reporting easier.
Custom Facebook Ads reports
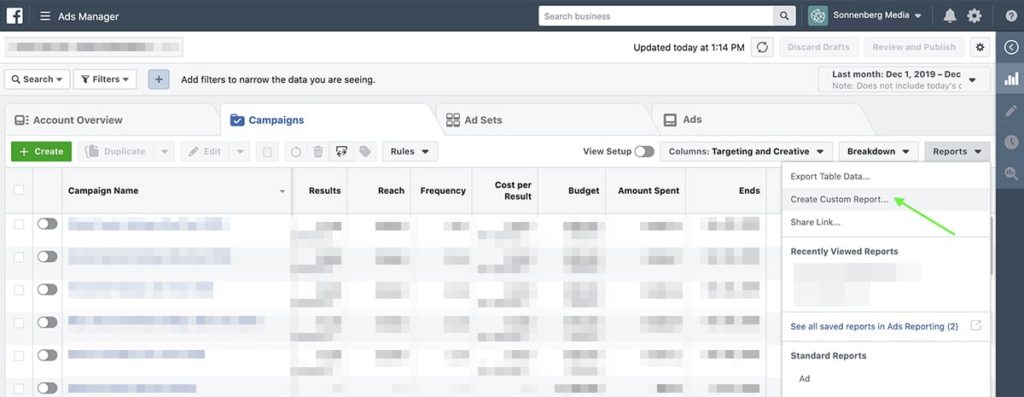
In the likely event that Facebook Ads’ default reports don’t fully meet your team’s reporting needs, create a custom report.
When designing a custom report, you can add everything from performance metrics like cost per result and quality ranking to engagement metrics (such as reactions and comments) and/or conversion metrics like landing page views and in-app clicks.
Choose the metrics that matter for your campaign, and put them in the most logical order so you can review the data easily.
Then download the spreadsheet so you can incorporate the data into your go-to report template or share a link to the report with a client or another member of your team.
Save the report so you can use the same layout for future campaigns with similar objectives.
In Conclusion
Facebook Ads reporting doesn’t have to be as daunting as you think. Follow these tips to handle Facebook Ads reporting without losing your sanity.
* * *
Sign up now for a FREE demo.


