A key to great Facebook Page management is a good understanding of your Page’s performance. You don’t need to be a Facebook Insights expert, but you definitely need to know how your page is performing, why it’s performing that way, and what you can do next.
Facebook offers you a multitude of metrics, but not every metric is a KPI – a Key Performance Indicator. So, you’ve had a lot of new fans lately, but what does that actually mean? Sure, your recent posts have had quite a few comments lately, but why is that? More importantly, why should your boss or clients care?
We see a lot of success from our bird’s eye view of the social marketing ecosystem, and we’ve been keenly observant on which metrics matter, and which ones don’t. As part of your 2015 social media resolution, I invite you to reconsider the metrics you report on.
Related post: How to Use Facebook Audience Insights for Better Targeting
Here are 8 proven metrics you should consider as key performance benchmarks in your Facebook reporting:
1. Fanbase
I think most of us will agree that the number of fans is not the most important metric to track on Facebook, and is by no means the key performance indicator for Facebook managers. That doesn’t mean that you should totally ignore it.
Don’t just show the number of fans, consider adding context as to how you got to that number. How many fans did you gain and how did you gain them (e.g. through content, a promotion, ads)? How many fans did you lose and why did you lose them (e.g. quality of content, post frequency)? How did you do in the previous months, and is there an upward or downwards trajectory in terms of fan growth? How do organic and paid reach play a part in all this?
Questions such as these go beyond vanity metrics and mark the beginning of understanding the community around your brand.
2. Source of fans
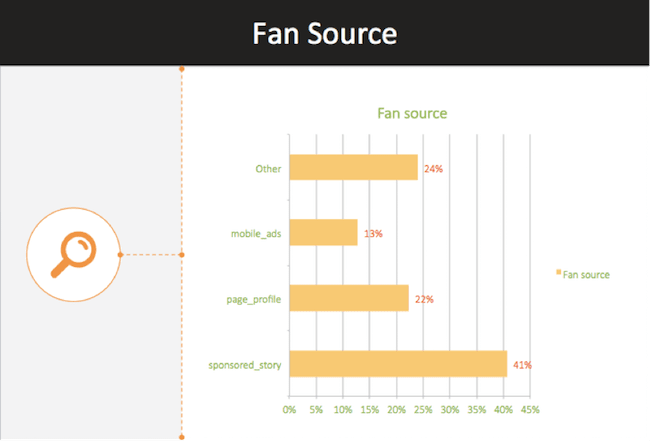
Do you know where they’re coming from? Not from a demographics point of view, but in terms of referrals. Facebook Insights tells you exactly where your new fans have liked you from: was it from an ad? Was it from a page invite? Mobile?
Was it from the relatively new “suggested pages” section?
Check your page referrals regularly, and you may find referrals that you weren’t aware of. For instance, if you assume that most people like your page by landing on it, you may be surprised to see how many people like your page from your content showing on their news feed instead, or perhaps from an external source of traffic that you knew nothing about.
3. Page views
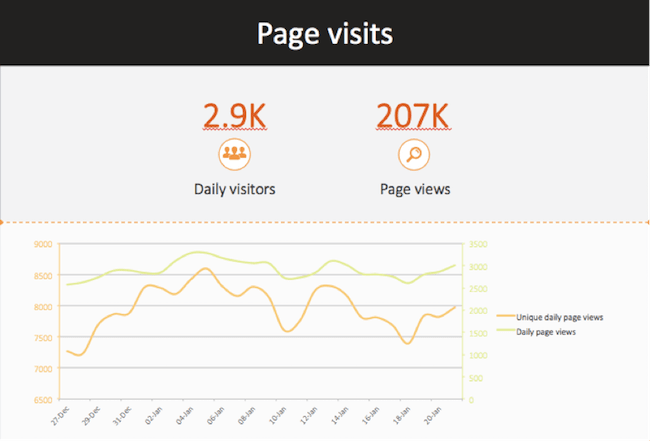
The fact that you’re referring a lot of traffic to your Facebook page (from your newsletter, from your website, or another source) doesn’t necessarily mean you can control fan growth or engagement.
If you’ve started referring traffic to your Facebook page, consider keeping a close eye on the “page views” metrics in Facebook Insights. You’ll also see if you’re having a spike in page views that you did not expect (e.g. your Facebook page being featured on another website).
4. Page Tab visits
It’s 2015. It’s time to clear your Facebook tabs.
I’ve seen quite a few pages with oudated tabs, and I can tell they’re outdaded because they either have dead links, or the dates are set too far in the past (e.g. for a past competitions). People will only see your tabs in a desktop view (never via mobile), it’s time to do some thorough spring-cleaning and get rid of the tabs you don’t use anymore.
You can easily tell which tabs still bring traffic by downloading your Facebook Page’s export and going to the “Daily Logged-in Tab Views” sheet.
Consider going through this “tab reporting” regularly, especially if you want to know which tabs work and which ones draw the most (or least) attention.
5. Reach
Remember when Facebook used to report on viral reach?
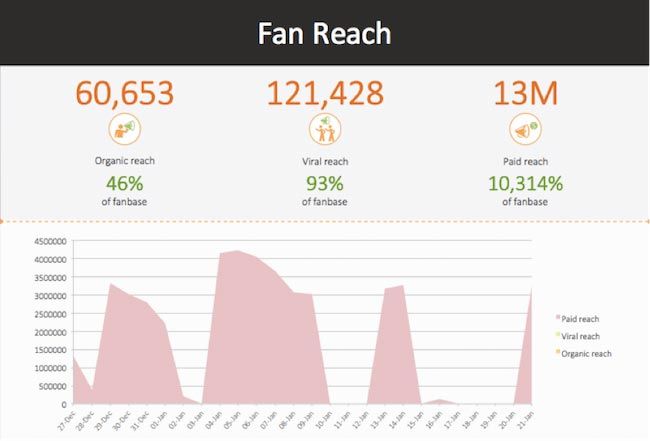
You can find Facebook’s definition of a “story” here, but in a nutshell: viral reach is the number of people who saw a post because one of their friends has engaged with it. Unfortunately, Facebook took this metric down, but you can still find it in a handful of Facebook tools, including AgoraPulse.
Showcase this number to show the knock-on effects of your content – how much are people engaging through your current fanbase? It’s already been predicted that organic reach on Facebook is on its way out. With this in mind, you can’t let your present reach slip away.
Consider actively tracking your organic reach to see what’s influencing it, and what trajectory it’s going in, then do the same with paid reach. Once you show these metrics to your managers/clients, it’ll be easier to justify investing more in paid media. Just make sure you also explain what those 3 types of reach mean (organic, viral, paid).
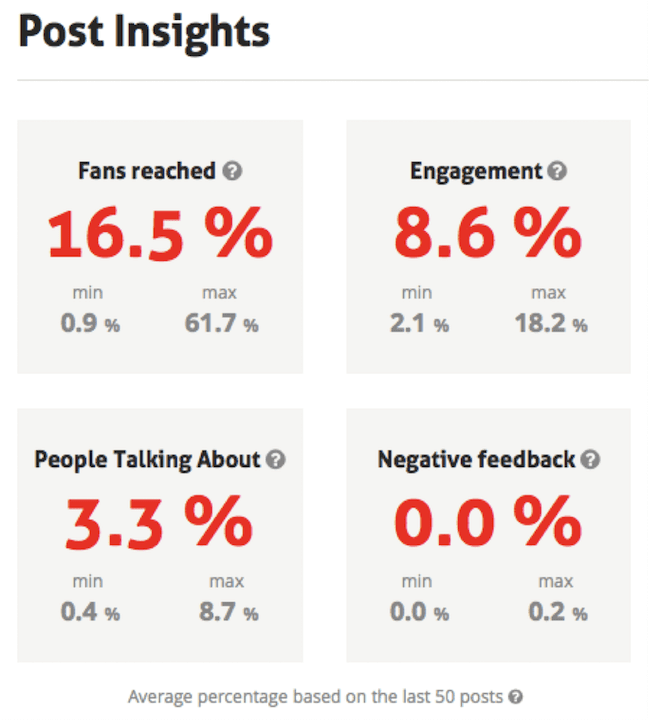
You can benchmark key metrics like reach, engagement and negative feedback (more on this later) against the average page’s performance via AgoraPulse Barometer. It’s free and it always will be. Give it a try and see how your metrics stack up with the rest.
6. Moderation
How many comments do you take care of on a regular basis (response rate) and how long does it take you to respond? If you already have a customer care team dealing with queries from social media, chances are they’re already using a tool to help them manage these comments, and chances are this tool offers some analytics into response rate, response time and other related metrics.
Instead of leaving this to a chance, make sure that you can track this. It’ll give you a glimpse into how efficient your team is at handling customer queries.
7. Negative feedback
Your content won’t always hit the spot, and it can’t always be right for everyone. Sometimes, people will react negatively to it by hiding/dismissing your post, reporting it as spam, or even unliking your page altogether.
Facebook tracks of all these actions and lists them under “negative feedback” (more on this here). Track this negative feedback and what drives people to give it. You may find that there are certain topics that don’t work with your audience, and you won’t always get that kind of feedback in the comments.
8. Content
Don’t obsess over likes and comments. Back when PTAT (People Talking About This) was still alive and kicking, a lot of marketers and tools relied on this metric to prove how effective their content was. Thankfully, this metric died last year, with Facebook pulling it out altogether from its analytics platform. Facebook’s removal of PTAT is a great thing, as it shows how important it is to focus on the individual elements that make up aggregate metrics (like PTAT) instead of relying solely and blindly on them.
Conduct a rundown of your best vs. worst posts. Don’t be scared to put the worst there: show why a few posts didn’t perform well, what you’ve learned from them, and what you’re going to do next time to achieve better results. Use multiple metrics to show your content’s true performance – success isn’t measured by just one metric.
This might seem like a lot to take in all at once, and that is totally fine. Take your time to identify how these metrics work for you. Take your time to understand the metrics you’re using from Facebook Insights, including the ones that may sound deceivingly alike (e.g. engaged users vs. consumers ).
What if I don’t have a tool to help me with all this?
There are quite a few great tools out there that you can use for Facebook Analytics. You can find a few suggestions here).
The good news is that if you’re already an AgoraPulse customer, you can use the PowerPoint export feature, which exports all of the key metrics I’ve mentioned here, with one click of a button. The graphs are useful and the metrics are easy to understand. If you’re not an AgoraPulse customer, you can take it for a test-drive here and try the reporting feature for yourself.


