Let’s talk LinkedIn.
When you’re developing your marketing strategy, it’s easy to overlook it. However, this B2B powerhouse can be a potent addition to your toolkit.
Whether you want to use the platform to build up your team, your client roster, or increase brand awareness, you can do it. I’ve used it to do all three.
LinkedIn, however, requires you to utilize different strategies and to create very different types of content than what you’re used to posting on other platforms, even if it’s just the style that’s changing.
Because these differences can range from small to significant, it’s important to figure out what’s working for your LinkedIn audience and why.
LinkedIn analytics can help with that.
In this post, we’re going to look at how to use both the native analytics and Agorapulse’s LinkedIn reporting tools to discover how to better connect with your audience on the biggest professional networking platform out there.
How to Find LinkedIn’s Analytics
LinkedIn’s best analytics data is pretty much reserved for their Company Pages right now, and won’t be the same as what you can find for personal profiles.
For this tutorial, we’re going to use the fake company page that I made for another post two years back, and have not thought of since. So yep, these engagement rates are going to be beyond depressing. I know this. Hang in there with me.
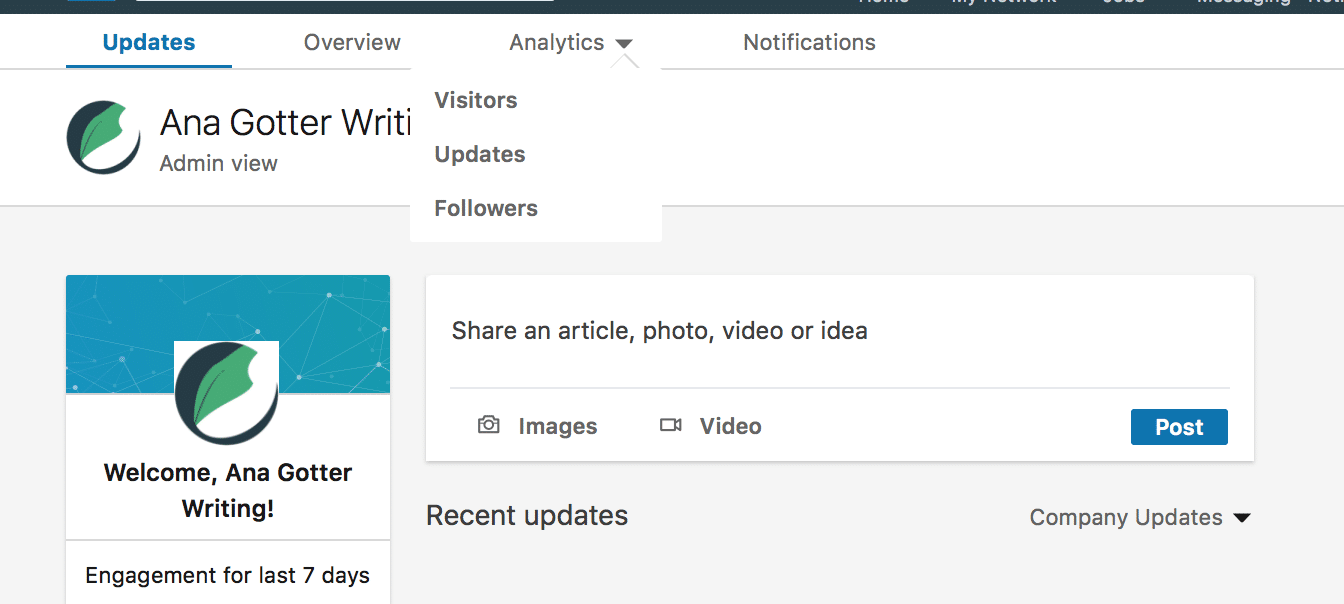
In order to find LinkedIn’s native analytics, navigate to your Company Page, and then click “Manage Page.”
Next, you’ll be taken to the Company Page.
There, you can upload new posts, get an overview of activity, or view more in-depth analytics.
Click the Analytics tab, and choose what you want to focus on.
LinkedIn’s Native Analytics: What You Can Learn
LinkedIn’s native analytics for Company Pages is broken down into three different categories: Visitors, Updates, and Followers. Here’s what you can learn in each.
1. Visitors
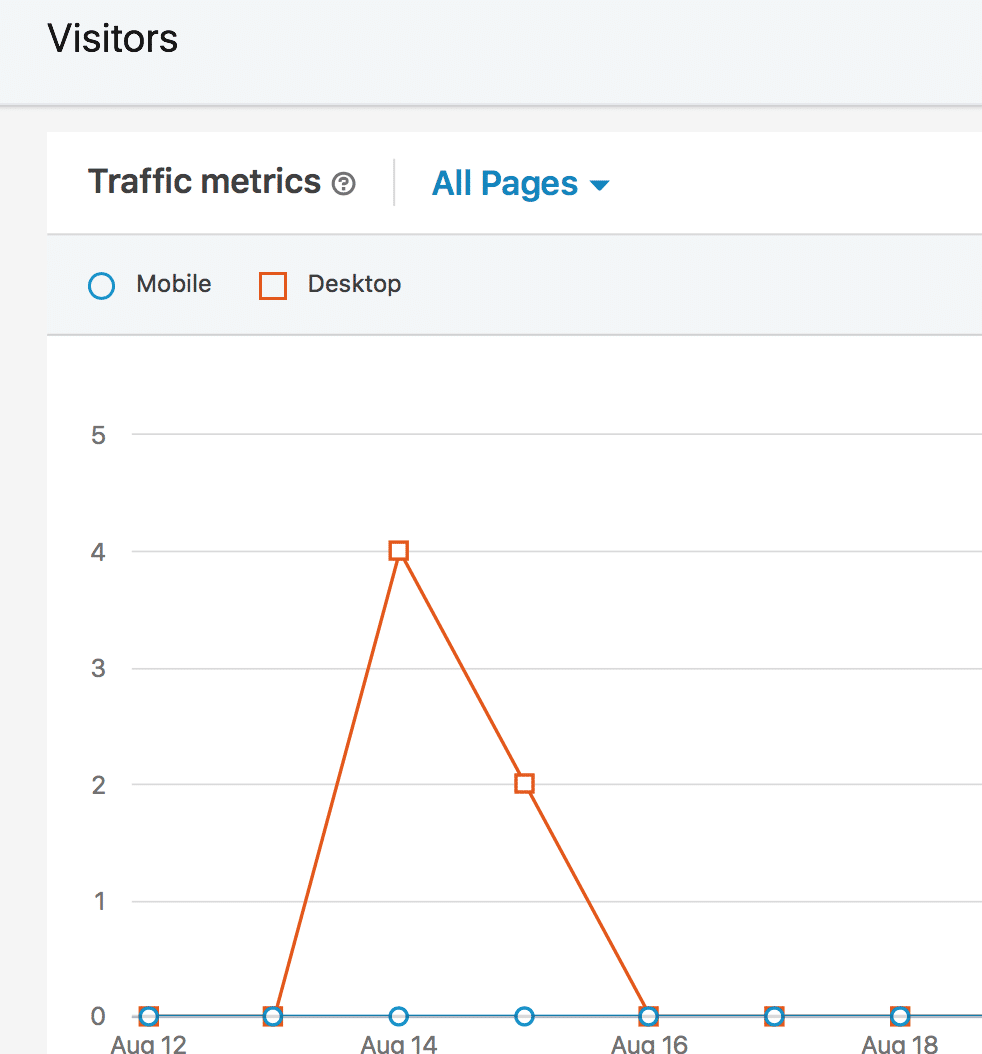
The visitors tab tells you how many people viewed your Company Page and its content within a set time frame. You can get data as far back as 12 months.
You can learn several things here about your visitors, including:
1. The total traffic that viewed your Page, and whether they were on mobile or desktop.
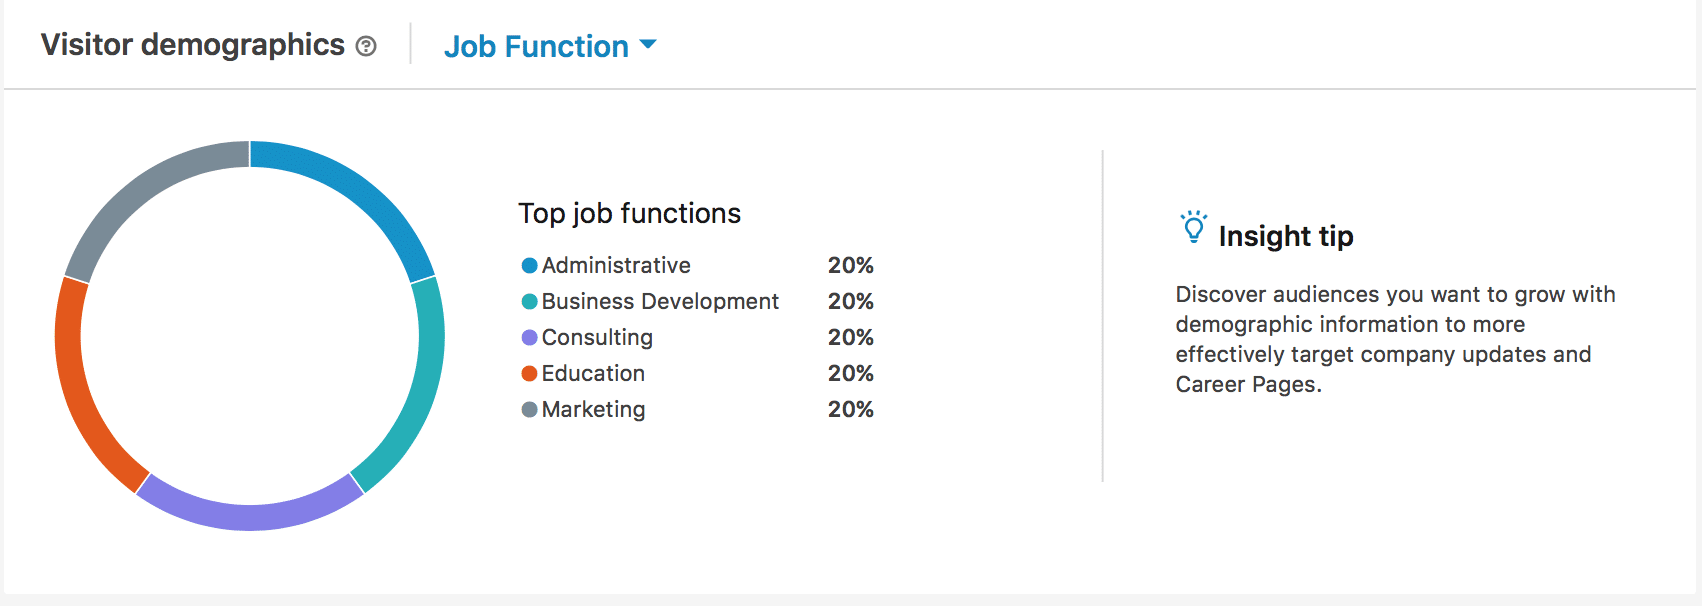
2. The demographics of users who visited your Page, including job title, company size, geographic region, and seniority level.
3. Which pages received the most traffic.
Use this info to see what types of visitors your Page is attracting, and if it aligns with the audience you want to target or your overall followers.
2. Updates
The updates section in LinkedIn analytics shows you the overall engagement trends and how specific posts are performing.
You can view post performance in terms of impressions, unique impressions, clicks, likes, comments, shares, and overall engagement rate.
This will show you which specific posts are getting the most engagement, and what types of engagement they’re getting.
You might find that some posts get a lot of likes, but others get more comments and shares, which increases impressions overall.
Use this to create more high-performing content in the future.
3. Followers
This section of LinkedIn’s analytics provides overall information about your followers.
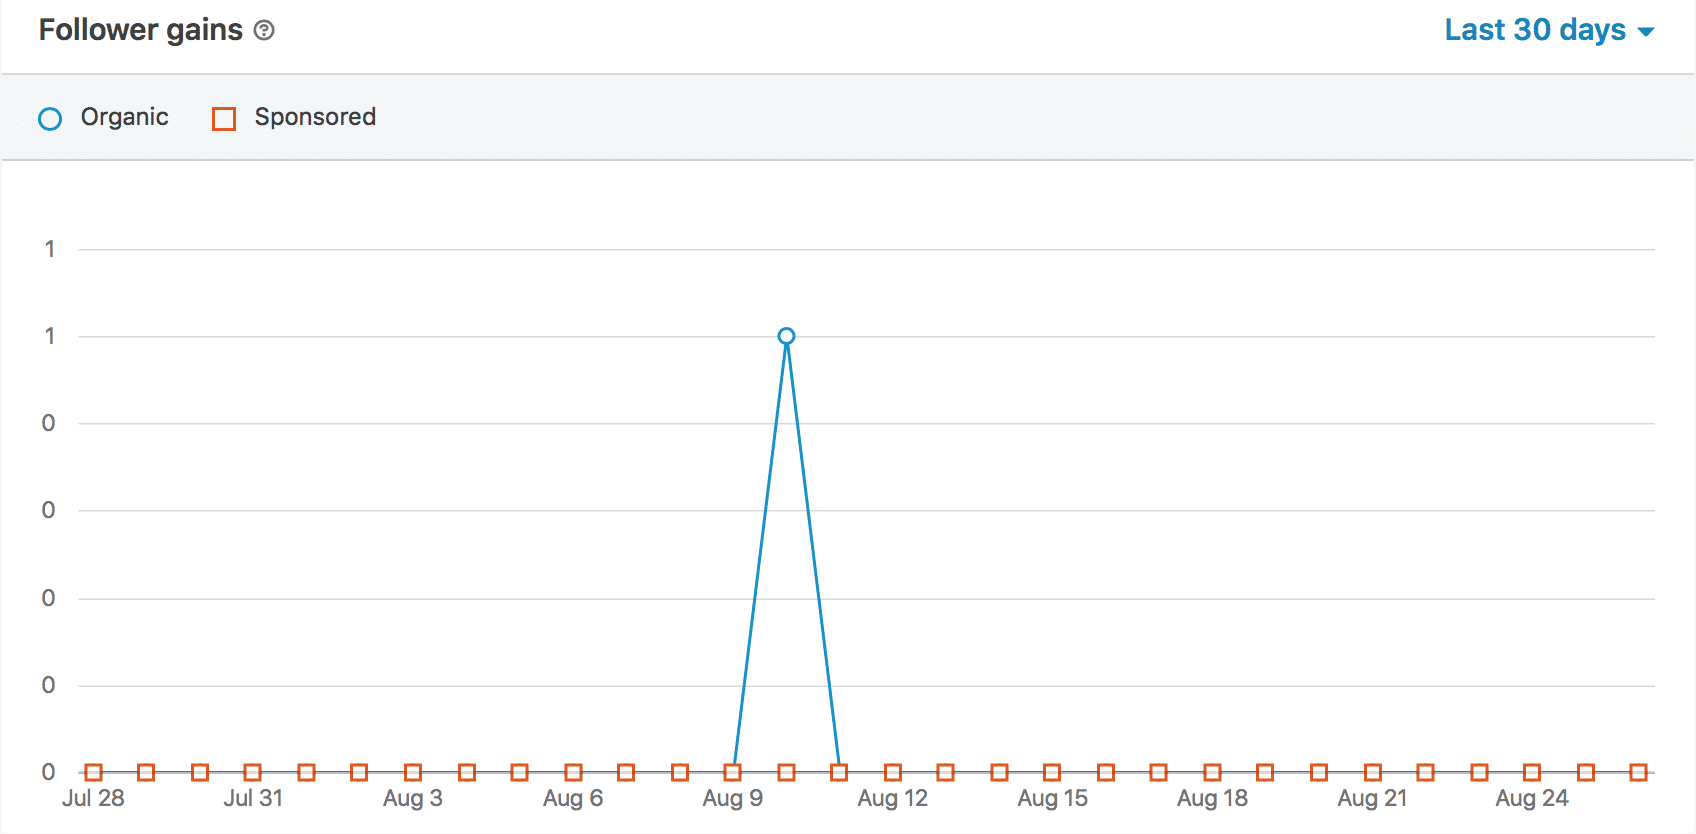
The first thing that you’ll see is follower count. You’ll see any recent gains or losses in followers, and you can use the trends and dates to look for any known causes. Did a post get shared a lot and increase followers?
Did you post something controversial and lose a few?
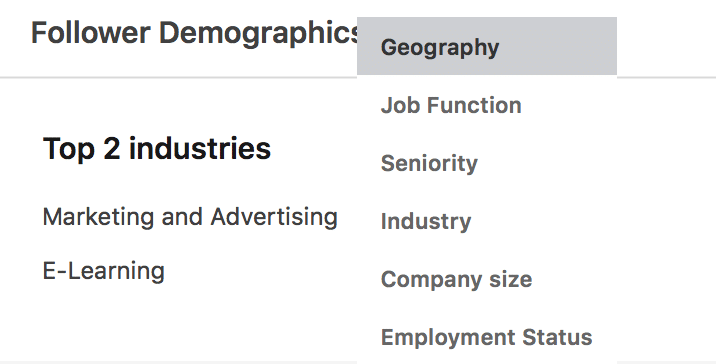
You’ll also see demographic information for your followers, including job function, seniority, industry, company size, and geographic location.
I recommend that my clients compare this information against their visitor demographic data to see if there are discrepancies between the two groups, and if so, why.
Or you can get this data from Agorapulse.
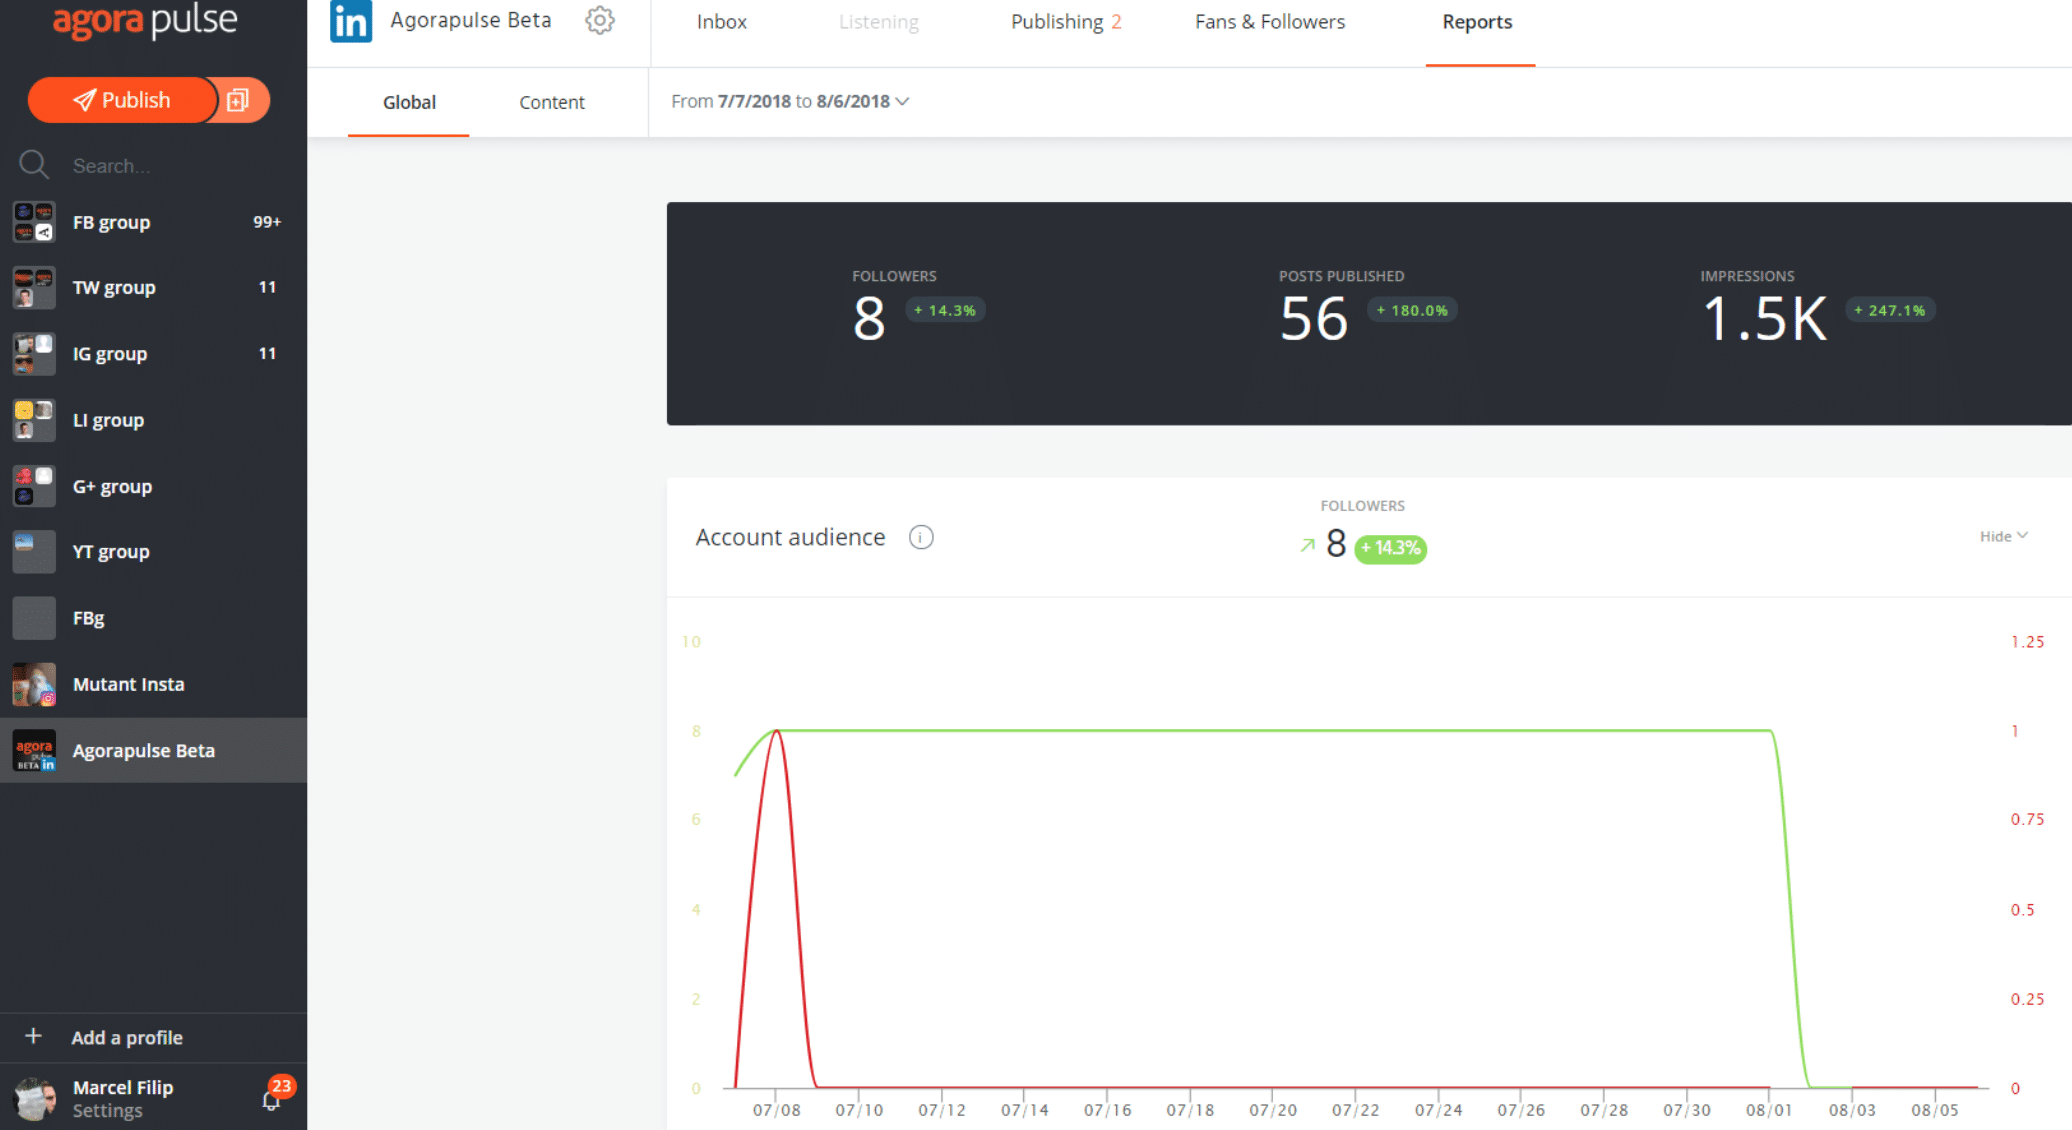
Our reports are similar to what you’re already familiar with from Agorapulse. They’re both detailed and easy to use.
The Global tab will give you a great review of how much you’re posting, stats on your followers, and your post reach.
The content tab will give you detailed information about each individual post and how each one is performing on the platform.
These reports are available company pages on LinkedIn. They come alongside enhanced LinkedIn features, including a LinkedIn inbox and more publishing features.
This will make it easier to create a single, comprehensive social schedule for LinkedIn that works with your other platforms’ campaigns, too. You can learn more here.
What if I Only Have a Personal Profile?
True, in-depth analytics (on and off LinkedIn) is only available for Company Pages. While you can still get some basic data on your personal profile, it will be much more limited and in several different places.
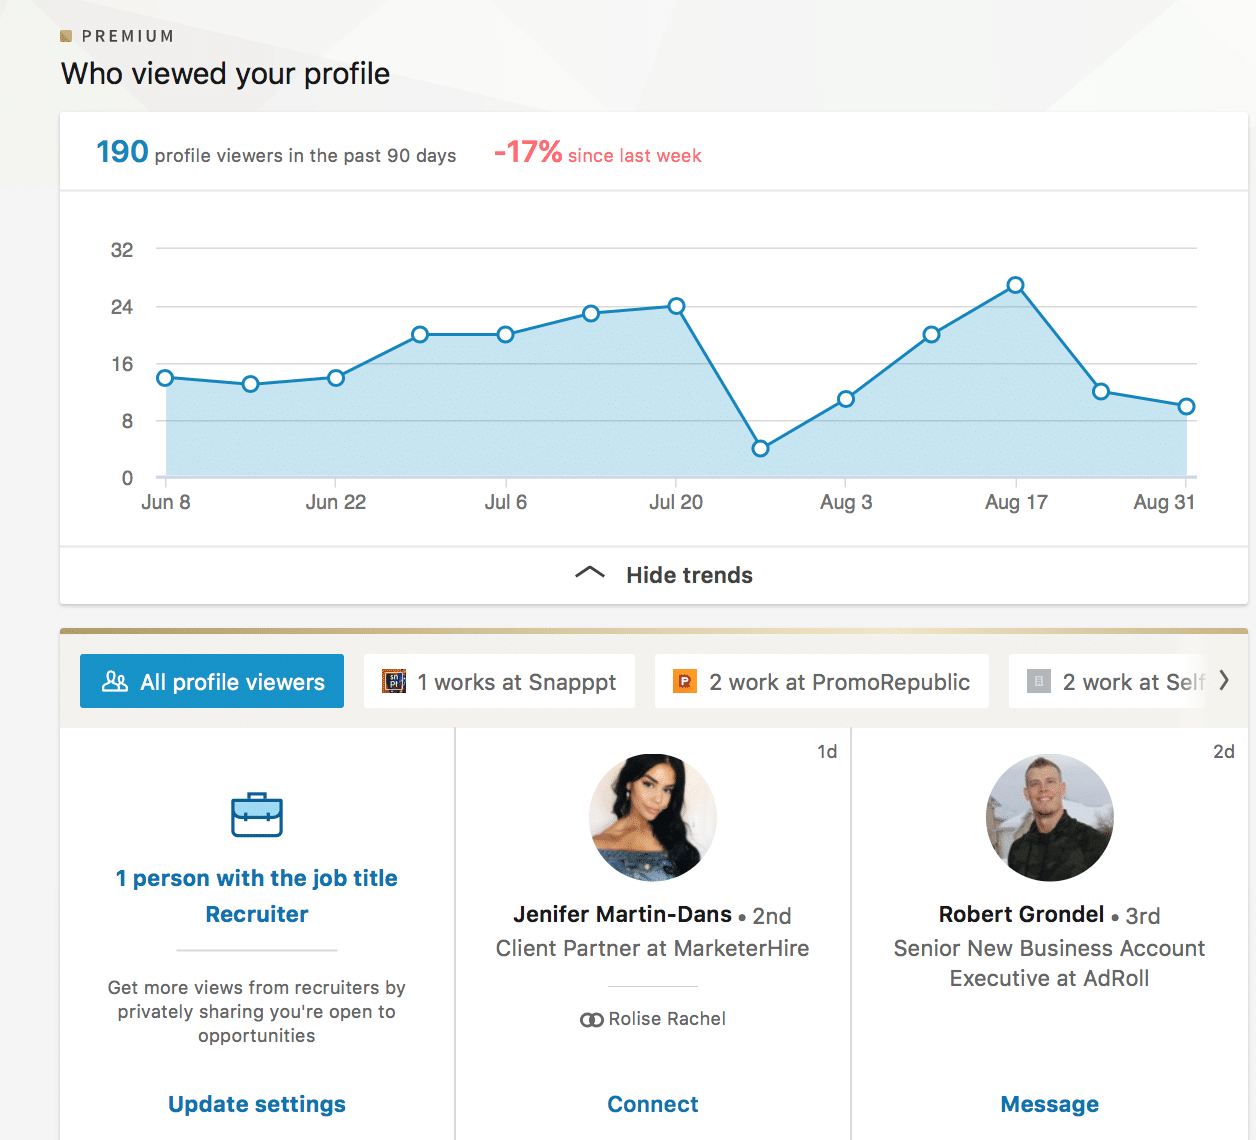
If you want to learn about who is viewing your profile, you’ll need to head over to the “Who Viewed Your Profile” section. If people have hidden privacy settings, or if you have tightened privacy settings, you won’t be able to see much here.
Sometimes, though, you can get lucky and see information about who is viewing your profile. You can definitely see how many people have been checking out your profile, which can start to help you assess if you’re showing up in enough searches or in the feeds.
You can also see information about your posts’ performance, but it’s a manual review process instead of a reported one, and you can only get the info on posts where the number of impressions are high enough.
To do this, head over to your profile drop-down menu, and select “Posts and Activity.” Then click posts, and you’ll be able to see how certain content performed.
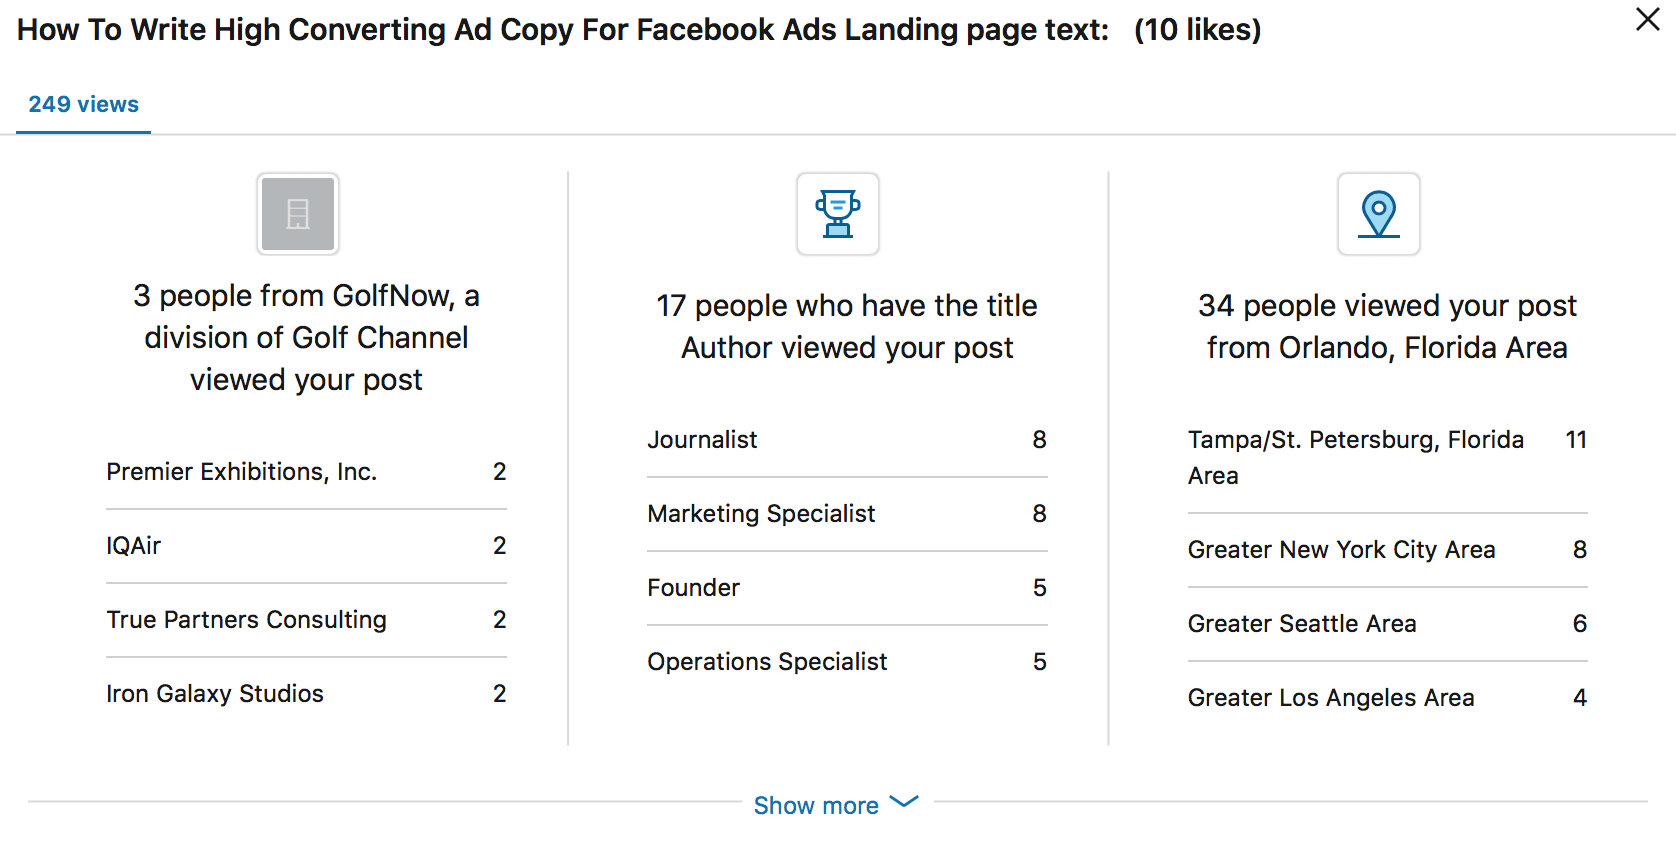
In addition to being able to see reach on posts that have gotten enough traction, you’ll see some general, anonymous information on who viewed it.
As you can see, this information is sparse, much more limited than Company Pages, and spread out across different locations.
This makes it much more cumbersome to use, especially if you’re managing multiple platforms.
If possible try to opt for a Company Page so that you’ll have access to the analytics data and all the other features that come with it.
In Conclusion
If you’re running any type of marketing campaign, you should be carefully tracking its performance. That goes for LinkedIn, too, and the platform’s unique standing as a professional networking site makes those analytics even more valuable.
The content audiences want on Facebook and Twitter, after all, may be slightly different, sure.
But you might be looking at apples and oranges in terms of content once you throw LinkedIn into the mix, so use the analytics to tell you what content is working best.
This will allow you to create more high-performing content moving forward so you can really connect with your audience.
Stay on top of your LinkedIn marketing performance with regular monitoring through LinkedIn analytics, made even easier with Agorapulse’s reporting.
* * *
Sign up now for a FREE demo.


