Are your social media marketing efforts driving sales? Is your sales team maximizing the leads given to them? And if you think they are doing so, how can you prove it? Enter the revenue dashboard.
In this article, we’re looking at the five best tools for creating revenue dashboards.
What Is a Revenue Dashboard?
A revenue dashboard will collate and showcase all your revenue-related metrics in one unified view. A revenue dashboard is often accessible by different departments for various inputs and insights.
A good dashboard will integrate with other platforms to accurately portray revenue. For example, with payment processor APIs like Paypal, Stripe, Braintree, Recurly, Chargebee, QuickBooks, and BlueSnap.
Examples of data you might see on your revenue dashboard
- Lead conversion from sales reps
- Revenue from social media campaigns
- Social media engagement vs ROI correlations
- Subscriber churn and Lifetime Value (LTV)
- Average Revenue per User (ARPU)
- Monthly recurring revenue (MRR)
- MRR gained from upsells and account expansions
- Burn rate
- Customer retention over time
- Customer satisfaction (CSAT) score
- Flow of revenue over time
- Revenue by product or service
Revenue Expectations vs Reality
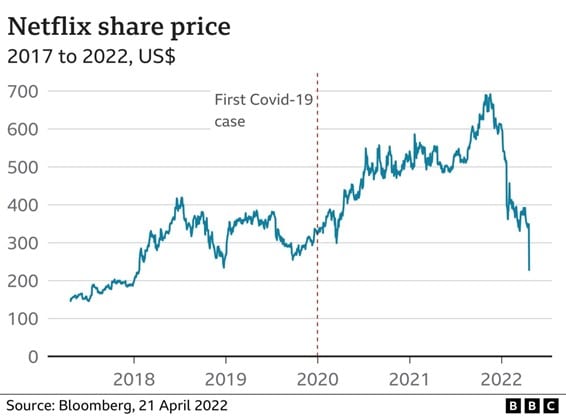
Wondering why you need to dig into your revenue figures? Let’s look at a recent example from Netflix.
Netflix had a great run throughout global lockdowns with subscribers increasing and revenue expected to continue rising. The streaming giant reported a net gain of 8.28 million subscribers for Q4 2021 totaling 221.8 million worldwide.
In April, however, Netflix released first quarter earnings for 2022, reporting a loss of 200,000 subscribers. That was a big deal for a business that had previously only ever seen sustained growth since 2011. Various factors, such as including cancellations due to subscribers going back to work, rampant password sharing, increased streaming competition and price hikes, were at play.
Netflix and other US streaming services lose $25 billion + a year in potential revenue due to password sharing. Netflix accounts for 25% of that total, meaning that the streaming giant is possibly missing out on around $6 billion in revenue.
A revenue dashboard will have shown Netflix where the company is losing money. It can draw correlations between new shows and reduced subscribers. Make calculations on estimated ROI based on regional subscriber growth, and project earnings based on subscriber profiles. Netflix has always been an intuitive company, and we’re sure with this knowledge at their fingertips they can turn things around.
What Are the Benefits of a Revenue Dashboard?
A revenue dashboard allows you to view your sales and acquisitions in real time. The difference between this and old-style monthly or quarterly reporting is that a more proactive approach allows you to pivot and make changes to help your business grow.
A revenue dashboard helps managers and stakeholders to:
- Quickly identify opportunities to increase revenue
- Track campaign performance and make changes in real time
- Track leads and identify high-performing team members
- Quantify resources and budget for different departments based on revenue
- Spot positive or negative revenue trends
- Identify their best customers (and get more of them)
- Uncover potential stumbling blocks
- Forecast future revenue figures (essential for shareholders)
- Help in the goal-setting process for individuals and departments
Most importantly, a revenue dashboard provides real-time data that updates each minute. So, you don’t need to wait until a campaign has finished to ascertain its performance.
Example of benefits of a revenue dashboard
You’re running a social media campaign to promote your new summer swimwear range. You have an advertisement running for a month on AdWords, Facebook, and Instagram with $500 allocated to each. Then you log into your revenue dashboard after two weeks and see that you have incredible sales from Instagram—but nothing much from Facebook and AdWords. You then have the choice to halt the non-performing ads and redirect your budget to the site that works best. This is instead of spending $1,500 and realizing, a month later, that those two platforms did not perform well.
How Do Companies Use Revenue Dashboards?
Revenue dashboards can be accessed by different departments. That feature is hugely important: Each department will have its own KPIs and together they add up to sizzling company growth!
A good revenue dashboard will allow key stakeholders to access and implement the changes they need to contribute to company growth.
Examples of how different departments might use a revenue dashboard
Marketing
Marketers will be looking at a revenue dashboard in relation to their email or AdWords campaigns, creative ideas, content, and social media marketing. As we know only too well, you can create a brilliant campaign that looks and feels great but just doesn’t deliver on revenue. (It happened to all of us at some point.)
A revenue dashboard is an opportunity to see which blogs or social media posts performed well and utilize those insights to create more content that audiences love. It’s also interesting to see which leads passed to sales converted into subscribers or customers.
Sales
A sales department dashboard can help a team set goals and track their overall performance. If they work from home, it can allow them to feel connected to other team members and see how their contribution added to the overall sales. With precise data and goals, management can identify weak areas and implement new measures like training or better communication tools if needed. Sales managers need to work closely with Marketing. (It can be a blame game between Sales and Marketing when a campaign doesn’t go well.)
A revenue dashboard cuts through the noise to show how Marketing helps Sales and how Sales helps Marketing.
Human Resources
Human Resources (HR) can also garner benefits from a revenue dashboard. Its high-level insights can help key HR personnel make decisions on promotions, recruitment, salary, and training. For example, if sales figures dropped after a round of new recruits were onboarded, perhaps the team needs better resources, equipment or product information.
Accounts
Of course, the accounts team wants to see revenue! A revenue dashboard can help them make financial predictions, budgets, and cuts. It’s also a great opportunity for them to spot revenue leaks. Like the Netflix example above, Accounts would draw conclusions between the number of viewers and the actual revenue. They would also flag significant losses or anomalies in the final revenue results.
Shareholders and directors
Company shareholders and directors use revenue dashboards to analyze high-level revenue performance. When used in Financial Planning & Analysis (FP&A), a company can implement key decisions for forward planning. These might include opening/closing regional branches, increasing funding for a department, raising subscriber rates, or launching a new product or service.
How Does a Revenue Dashboard Help in Social Media Management?
A revenue dashboard can be incredibly beneficial for social media management. Because a revenue dashboard is viewed in real time, social media marketers can access analytics and insights that will help them make critical decisions and improve ROI.
At Contentworks Agency, we utilize a combination of Google Analytics and Agorapulse to provide insights for our clients. The type of stats we are looking for include:
- Engagement on social media posts—especially ones that have been boosted
- The impact of user-generated or micro-influencer content on your revenue figures
- Understanding the connection between social media following and revenue. (Taking this one step further, the regional differences, such as a higher conversion rate in the UK as opposed to the USA.)
- Popular blog content and how tracked leads result in signups or conversions
- The performance of shoppable posts in terms of click throughs and revenue
- The popularity of specific hashtags in posts and tweets and audience responses to them
Example of how a revenue dashboard helps with social media management
By digging into our own analytics, we can see which channels brought in paying customers. And even more than that, how long those customers stayed and therefore what their LTV will be. It sounds like a lot of work, but it’s worth it!
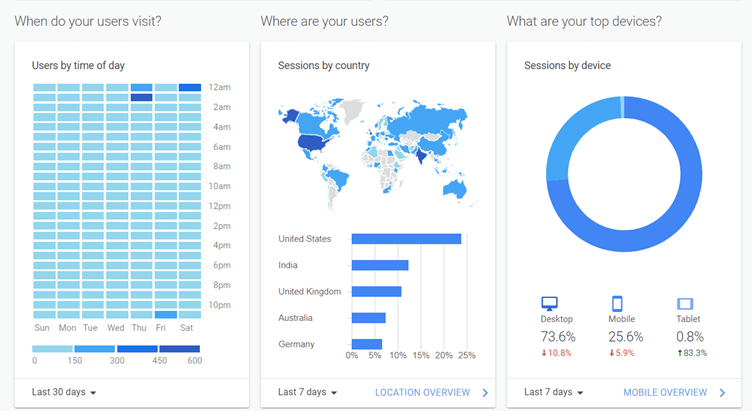
By using a revenue dashboard, we can reproduce popular blogs, posts, landing pages, or campaigns year on year or replicate the format. Below is an April Google analytics screenshot that allows us to analyze key metrics that can guide future decisions.
5 Revenue Dashboard Tools to Check Out
Now we’ve looked at what a revenue dashboard can do for your company, let’s look at some popular tools.
1. Chart Mogul
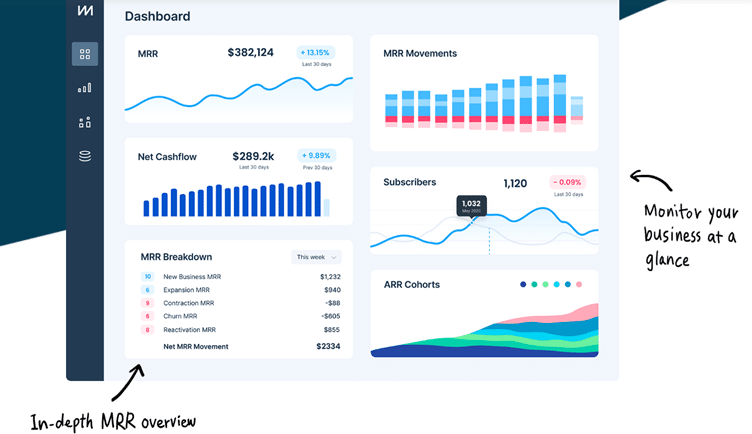
Chart Mogul streamlines the revenue management process and allows you to focus on the key SaaS (software as a service) metrics for your business. The main benefits of Chart Mogul are that it allows subscription business model users to evaluate the profitability of their business. It also provides insights on subscribers and subscriber behaviors. Also, Chart Mogul is able to integrate with popular payment and billing systems.
Key features of its revenue dashboard
- Define custom plan groups
- Customer lists and profiles
- Multiple churn formulas
- Multi-currency support
- Define custom sales regions
Chart Mogul offers a scalable pricing structure starting with a free solution for brands with less than $10K in MRR.
2. HubSpot
With HubSpot, you can build dashboards to keep track of the insights that matter or pick a dashboard template. Sales leaders can pair fully customizable sales reports with sales analytics for real-time updates on team performance, deal status, and deep pipeline insights. Share best practices from top performers, and coach up sales reps who need some help with AI-powered call transcription and analysis. HubSpot isn’t just for sales either. It offers a CRM and complete marketing integration, so it can be beneficial to multiple departments.
Key features of its revenue dashboard
- Deal Forecast and funnel reporting
- Manage Facebook, LinkedIn, and Google ads and track which are turning into customers.
- Sales activity reports
- AI Intelligence for personalization and insights
- Track ROI with revenue attribution reporting.
HubSpot offers a free basic version which you can keep using or scale up to add more features as your business grows.
3. Google Analytics
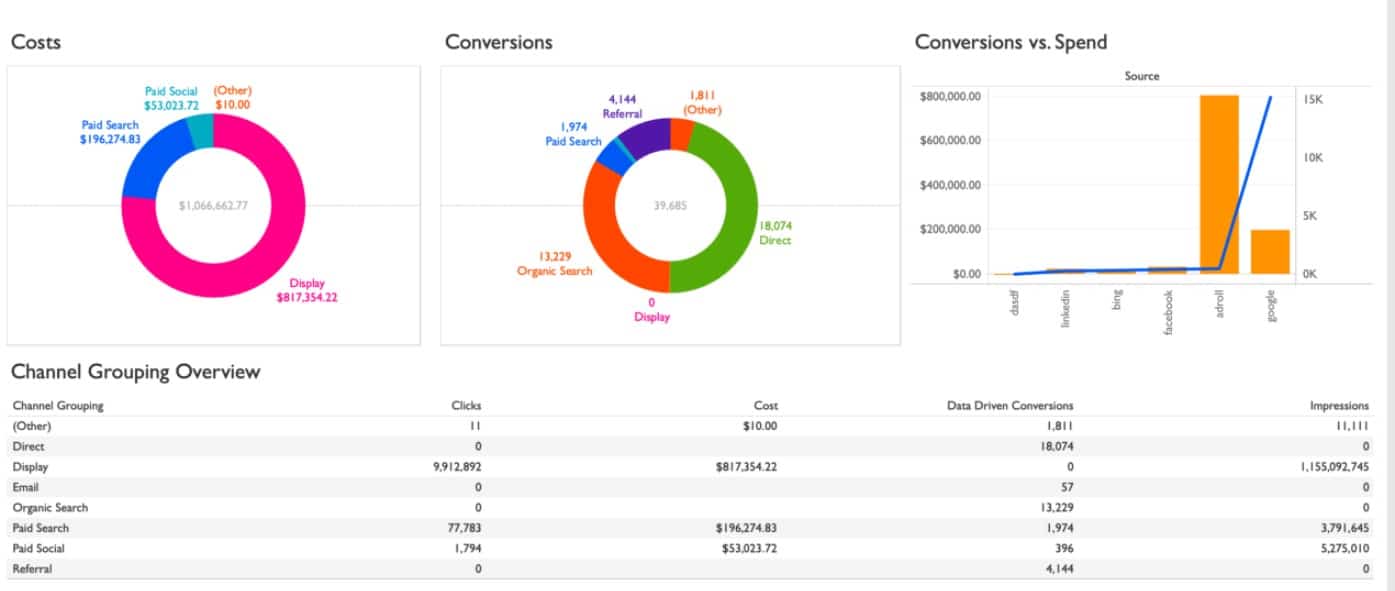
Revenue tracking in Google Analytics is an important aspect of marketing for most companies. In Google Analytics, you can see your revenue by marketing source as I showed above. Also, revenue per user, per country, per campaign, and so much more. Google analytics works whether you’re doing organic or paid marketing and connects with your website, social media channels, and AdWords if you choose to run ads there. Another key feature is your ability to uncover audience behaviors and how they link to your revenue.
For example, males aged 25-34 located in North America using a mobile device at 4 PM are most likely to buy X product. This is key data that can help to shape your future campaigns. One of my favorite things about analytics is that data is presented in an easily understandable way. This is helpful if you’re not a fan of spreadsheets or you want to present key data to others.
Key features of its revenue dashboard
- Reporting and visualization
- Funnel analysis
- Tag management
- Smart goals
- Data activation
- Integrations
4. Tableau
Tableau is not a newbie in the revenue dashboard space … It was founded in 2003 as part of a computer science project at Stanford! That should tell you how serious they are on data accuracy. Tableau’s machine learning, statistics, natural language, and smart data prep are solid foundations of its product offering. Tableau was acquired by Salesforce in 2019, but it remains focused on helping people to see and visualize key data.
Key features of its revenue dashboard
- Tableau Dashboard with visual overviews
- Trend analysis
- LinkedIn sales navigator connector
- Collaboration and sharing between departments (or clients)
- Advanced visualizations (Chart Types)
- Ask Data (much like a Google search in the platform)
Tableau is long established and so has an extensive list of features for sales, marketing and upper management. Tableau starts from $70 per user per month and scales up from there. There is, however, a free trial so you can try before you buy!
5. Agorapulse
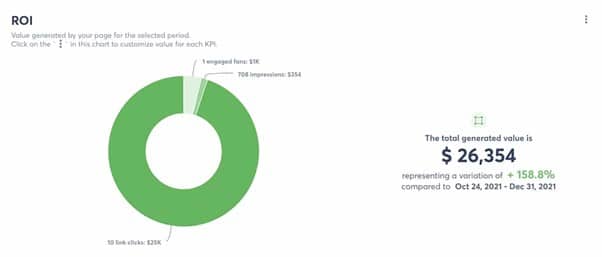
No revenue dashboard list would be complete without talking about Agorapulse. Agorapulse is a marketing dashboard that’s perfect for small to large businesses and agencies managing multiple clients. In addition to providing a social media scheduling calendar, social media monitoring and the ability to assign team members, create auto replies, and streamline your inbox, Agorapulse also has plenty of ROI and revenue features.
Agorapulse’s revenue dashboard also allows you to connect ad accounts to view the revenue of your marketing campaigns. Additionally, it has the best-looking reports in the business, allowing you to present your great results and make sure they get noticed!
Key features of its revenue dashboard
- Essential core social media metrics
- Benchmark your performance against competitors
- Assess your response time on social media
- Colorful and impactful reports
- ROI calculator and date comparison
- Monitor ad comments, stats and results.
Agorapulse offers a free trial that includes all the features of the fully fledged solutions. It also offers a free option for brands just starting out. Start your free trial here.
In Conclusion
A revenue dashboard is a great tool to add to your sales and marketing arsenal and with many software providers offering free entry options you can always try them out for yourself.


