Instagram Stories are crazy-popular right now. Brands are cranking them out at an almost frenetic pace—but not everyone’s measuring just how those Instagram Stories are really doing. (Need a good Instagram Story tip?)
Savvy social media managers, however, know how vital metrics and reports can be to seeing what works, what doesn’t, and what needs adjusting in their social media campaigns.
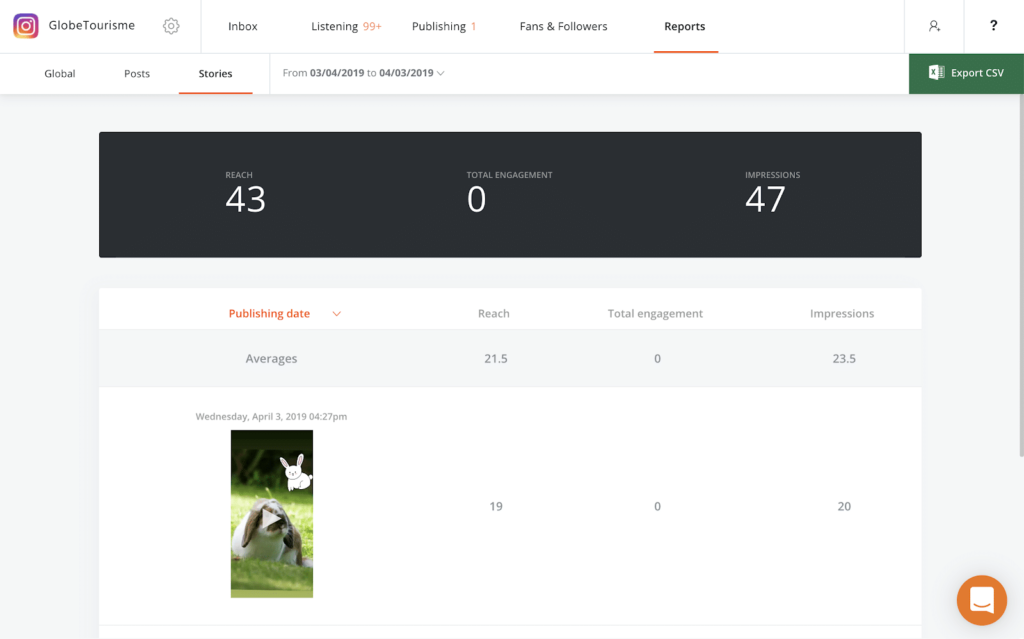
So, at Agorapulse, we recently added downloadable reports and metrics for Instagram Stories to help social media managers do just that.
We also recently reached out to a few social media experts who love Instagram, too, to see what their favorite Instagram Story stat is and, more importantly, why that stat is so important to them.
Related Post: 7 Best Practices To Rock Your Instagram Stories
Here’s what they said.
Amanda Webb | small-business owner and social media expert at Spiderworking
Amanda’s Instagram story tip
The stat I like the most is “tap back.” It’s always low, but it has value.
Users will tap back if they feel they have …
- Missed an important element of your story
- The slide skipped forward before they had finished consuming
It tells us that people are engaged with our content rather than just tapping through.
It also helps with evaluation. If a slide gets a lot of tap backs, we can evaluate what people were tapping back to. Was the slide full of text so people needed longer or was the message of the slide not strong enough?
Donna Moritz | digital strategist at Socially Sorted
Donna’s Instagram story tip
When it comes to stats on Instagram Stories, I want to know primarily about retention and engagement … Who is watching my Instagram Stories and for how long and in what way?
Instagram Stories are all about engagement, and being able to dig deeper into where people are engaging with content (and where they are dropping away!) helps me to know what to post more of.
One frustrating thing about the current Instagram Story Analytics is that they go away. Life means that sometimes you don’t always get to come back within 24 hours to check the stats. So, having access to that data on an ongoing basis is super helpful. (Thankfully, Agorapulse now has that function!)
Ian Anderson Gray | founder at Seriously Social
Ian’s Instagram story tip
I love Instagram stories. They allow me to create fun content that’s quick and easy to create and, most importantly, is more raw, authentic, and human. I prefer it to the main Instagram feed, and I get a lot more engagement that way—with real conversations. The fact that stories only last for 24 hours helps to keep the content fresh and also stop me from that never-ending spiral of perfectionism!
But the big downside of them only lasting for 24 hours is that, well, they disappear!
I do try and monitor the engagement of my stories in those first 24 hours. That’s important if I want to see who has been viewing them because that data disappears. Being able to see which people in my audience view and engage with my stories is really important.
The most important story stats for me are the reach, engagement, and exit. Being able to see how many people are seeing my stories helps me work out if they are resonating with people.
One of the most powerful features of stories is the way people can respond directly with a message. Being able to see the level of engagement is really helpful. And finally, seeing how many exits per story is helpful in me working out which stories don’t resonate so well. People exit stories for many reasons—such as needing to focus on something else, but sometimes, it’s because they are bored with your story. That’s not good, and the exit stat helps you determine if this might be the case!
Ian Cleary | founder at Razor Social
Ian’s Instagram story tip
Instagram stories are a powerful way of engaging with your audience, but you really need to track analytics to see what is resonating with your audience. I want to see the number of unique people that see my stories, but I also want to see how many people have engaged in the stories (e.g. like, comment).
I also want to see how many people tap forward to see the next part of the story. “Story” is the most important word in this. For a story, you need to think of a beginning, middle, and end, and you always need to think about what the person watching/listening to the story is getting out of it.
It’s not a series of random images you share. If you’re structuring it like a story, it will create some anticipation of what is coming that will make people want to stick around. Creating great stories will increase your engagement and taps forward which will result in more unique users in the future as word gets out about valuable content you share!
Jay Baer | founder at Convince and Convert
Jay’s Instagram story tip
The engagement data for stories is most useful because it’s the most reliable indicator that the content was interesting or useful.
Jeff Sieh | founder at Manly Pinterest Tips
Jeff’s Instagram story tip
Taps back and exits are the most important statistics for me. I want to know what content is not resonating with my audience or if I’ve overwhelmed them with too many Stories.
The last thing you want someone to do is mute your story. You may never get them back!
Jenn Herman | social media strategist at Jenn’s Trends
Jenn’s Instagram story tip
Story metrics I look at (in priority):
Retention rates from one Story to the next. I like to know how well I’m providing value to my audience, so if they are staying through the whole Story set, I know the content is valuable. Similarly, if I see a big drop in retention on one or more posts in the sequence, I like to know which Story caused that so I can determine what was the cause of loss.
Swipes/clicks on links in Story posts allows me to track conversions. If I’m giving people a CTA, I want to know how many are taking action on that. I’ll also often include the same link in more than one post in the sequence and I like to know which one generated the most clicks so I can craft better CTAs or better understand where in the sequence people are likely to take action.
Replies to Stories because this is the only metric that begins to track a DM. I get a lot of DMs from my audience, and this is a valuable metric in relationship building and knowing who my superfans are. Knowing how many people are triggered to message me directly from a Story allows me to see how I can better connect with my audience in the future.
Discovery, and specifically Impressions vs Reach. Impressions should always be higher as that’s how often the average person saw the post. The higher the ratio of impressions to reach, the more often people are re-watching that Story. Since I share a lot of educational content, this is valuable for me to know which posts are generating repeat views and ranking as valuable to my audience.
Views from location tags and hashtags are great to know for reach to NEW audiences. Views from these tags mean you have appeared in searches for those tags and were most likely seen by new people, allowing you to expand your reach and attract new followers.
Total view count is still a vanity metric, but it’s good to know how many people are watching your Stories. I don’t get a ton of views on my Stories, in proportion to my follower count. Most of my audience prefers my content in the feed, not in Stories. But without seeing view counts, I wouldn’t know this.
Mari Smith | at Mari Smith
Mari’s Instagram story tip
I love that Agorapulse shows me reach, total engagement, and impressions and that I can quickly sort each of these columns by ascending or descending order. This gives me a quick sense of what type of content my audience responded to most, and I can then easily click into any given Story to see additional stats.
Along with these primary metrics, I like to know these four stats for each of my Stories:
1. Actual viewers. I like to skim through the list of viewers to see which people I personally know that have taken the time to open up one or more of my Stories. As I scroll down the list of viewer profile pics, I can see that approximately 60% currently have active Stories themselves. This also gives me a sense of how frequently other Instagram users are publishing, or not.
2. Replies. This is one of my key metrics to know for every Story. The more replies generated, the more successful the Story content. This is what I call “micro-engagement.” People absolutely love to touch their phones. (Some studies say as much as 2,600 times a day or even more!) The more you can give your audience an excuse to tap a sticker, or slide the poll, or send you a heart or a comment, the more you’ll increase your engagement and loyalty.
3. Sticker taps. I really love to promote other people in natural, organic ways—whether personal friends, colleagues, clients or brands that hire me as an ambassador. Seeing the number of visits I’ve sent to someone else’s profile by including their @ name and a CTA is always gratifying to me.
4. Profile visits. This helps to see what Story content compelled a viewer to come check out my profile for more content or to tap my link in bio.
Neal Schaffer | at Neil Schaffer
Neil’s Instagram story tip
I consider Instagram Stories a separate social network within social media. Stats have shown that it has a huge amount of users consuming information there, and I have found many Instagram users who don’t post or rarely post yet frequently publish to or consumer information from Instagram Stories.
With that in mind, it would be awesome if there was a tool that could provide me the following insights from Instagram Stories:
- % of viewers who completely watched the entire Story (as opposed to merely swiping through yet still counting as a visit. This is critical for content quality analysis)
- Stats on who my most engaged Instagram Stories viewers are
- Uncovers opportunities to follow back potential brand advocates by letting me know those viewers who I am not currently following yet frequent my Stories content
In addition to the other stats you would expect to see about Instagram Stories, the above three would give truly actionable data on my content as well as followers.
Sign up now for a FREE demo.


