 Results")


Your social media team crafts beautiful content, engages with followers, and fields comments daily. You’re feeling productive and fulfilled. But do good vibes tell you—and the other teams you work with—that your team’s work matters? If you want to showcase your team’s contributions, you need to build result-driven reports. Reports that spotlight performance trends, validate resource allocation, and power smart decisions that executives care about.
Agorapulse turns meaningful metrics into “a-ha!” moments that anyone can grasp—even your colleagues not on “The Facebook.” All while saving your team hours of manual work each month.
Create your free account of Agorapulse and deliver reports worth reading.
How to Set Up Your Social Media Team Reports
Agorapulse makes creating, running, and sharing team reports with all your stakeholders easy. Setup is also incredibly simple. Within 15 minutes, you’ll have laid the groundwork for oodles of powerful, holistic reports to come.
How to it works
- Once you’ve added your social profiles to Agorapulse, connect your Meta (Facebook/Instagram), LinkedIn, and TikTok ad accounts. This will let you access paid social metrics in your team reports.
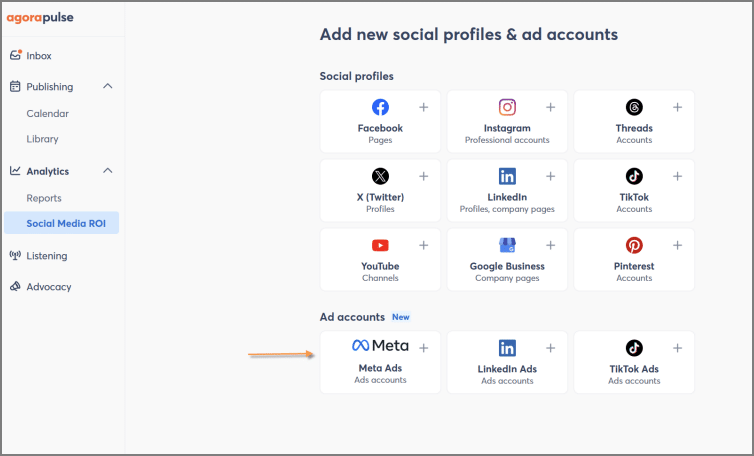
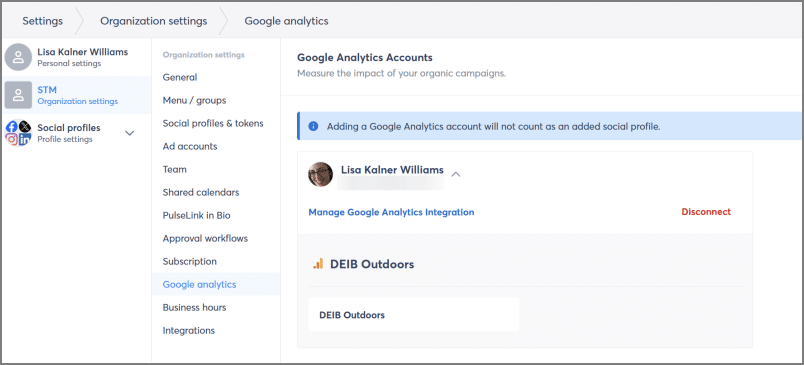
2. Connect Agorapulse to your Google Analytics account to pull relevant conversion data.
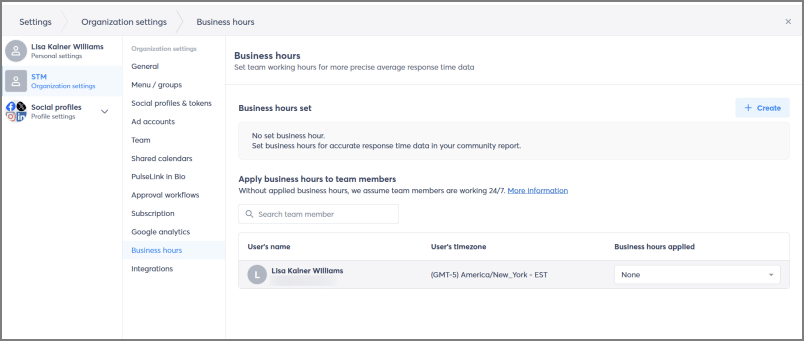
3. Set up your organization’s business hours to provide accurate community management metrics. Once you’ve saved your business hours in Agorapulse, your team members will be tracked on responses set within those hours.
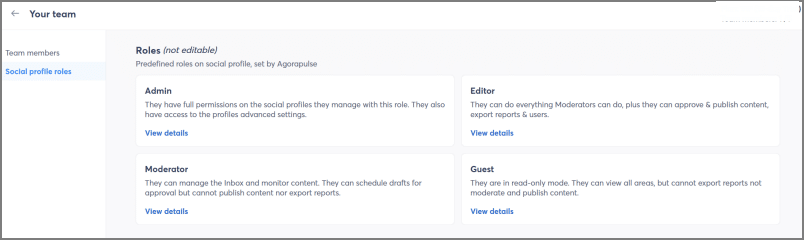
4. Select which team members have access to reporting features. Editors and admins view and export reports. These two user roles can also create, edit, delete, schedule, and export customizable Power Reports.
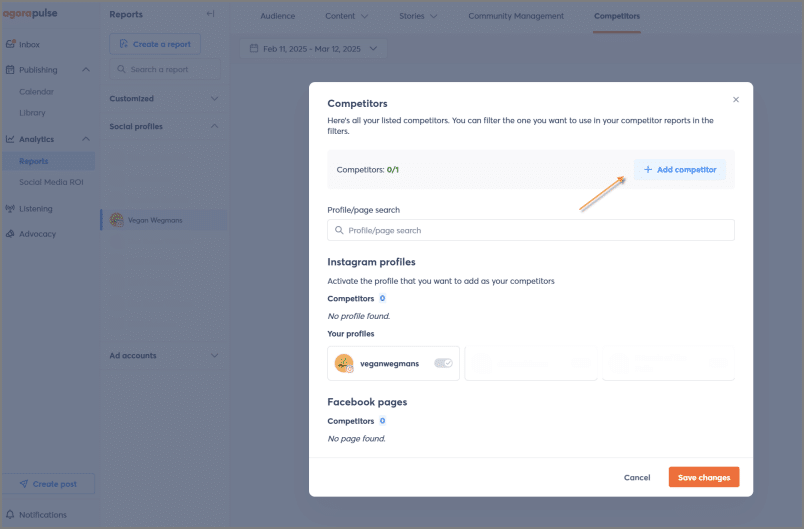
5. Once you’ve set up your organizational settings and added your social profiles, add competitors whose social media metrics you’d like to track.
6. If you want Agorapulse to send weekly or monthly reports to your team, set up your report scheduling options.
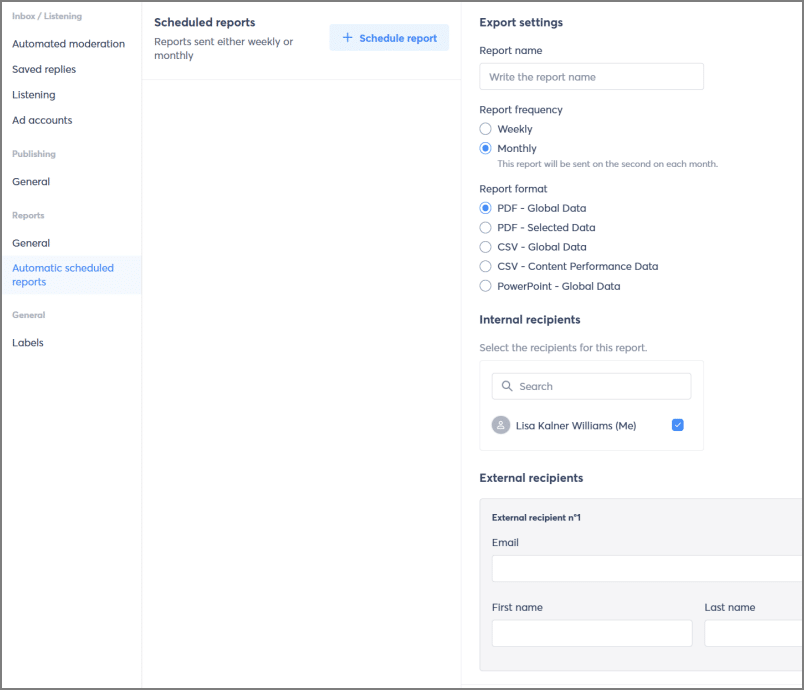
Here, you can also select options for language, time zone, day of week sent, and date/time format.
Bonus: Agorapulse lets you automatically send reports to people who aren’t users on your plan. What a great way to save time, money, and user seats!
Key Metrics and KPIs to Track in Team Reports
Effective social media reports focus on the metrics that matter most to your business goals.
What to track in your social media team reports
Here’s what you should be tracking:
- Reach & impressions. These visibility metrics show how many people saw your organic and paid content. If you run ads to increase visibility, consider separating organic reach from paid reach. (Ditto for impressions – separate organic from paid.)
- Engagement rate. This tells you how compelling your content is by measuring its likes, comments, shares, and saves relative to its reach.
- Video views. Social media experts say we should all post more videos. But is video content worth the time and money? Tracking this KPI will help you answer the question.
- Event completions. Here, you can track how many website events are completed after someone clicks a link on your social content.
- Event value. This is the metric you give to someone who tells you, “Show me the money!” The numbers here reveal the website events’ value generated by your social media content
- Funnel by source. Sure, TikTok is super-popular. Is it also super-profitable for your business? You’ll find which social platforms send folks to your website here.
- Average response time. Evaluate your team’s replies to social media comments and messages as a whole and for each team member.

Interpreting Reports for Data-Driven Decisions
Raw numbers don’t say much about your social media performance. It’s the analysis of these numbers that helps your social media team improve its content and contributions to your organization.
Let’s explore how Agorapulse makes it easy to analyze your performance on social media.
Identify engagement and reach patterns to optimize content
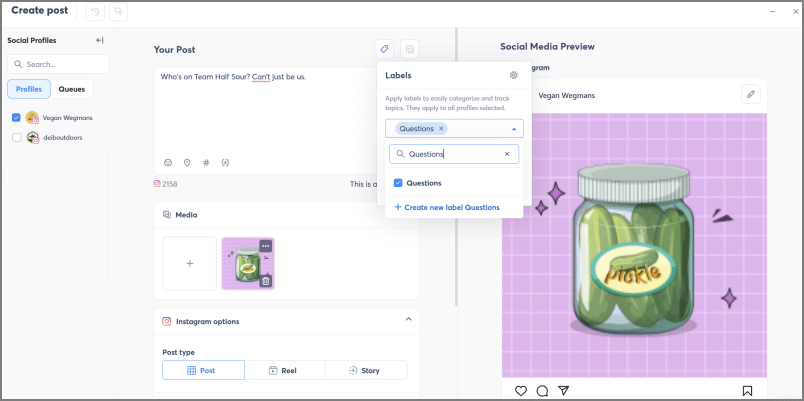
Want to see which campaign or topic has been performing well? Use Agorapulse to label your content in Agorapulse and get a breakdown by engagement or reach.
Labeling content by social content creator lets you discover which team members bring in the most eyeballs or reactions.
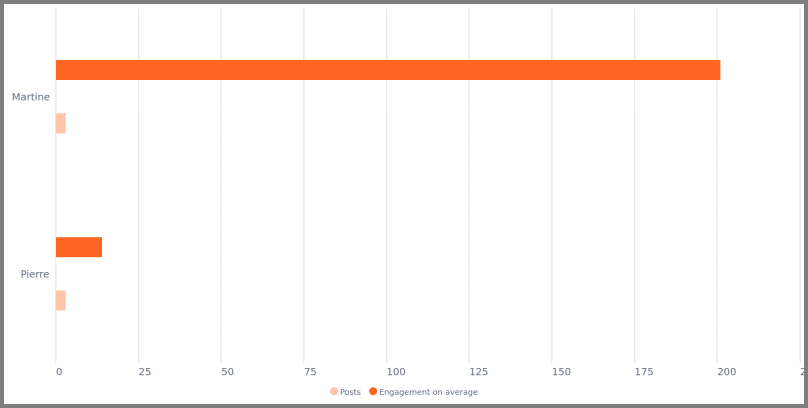
Agorapulse reports also show which post types drive the most engagement and reach.
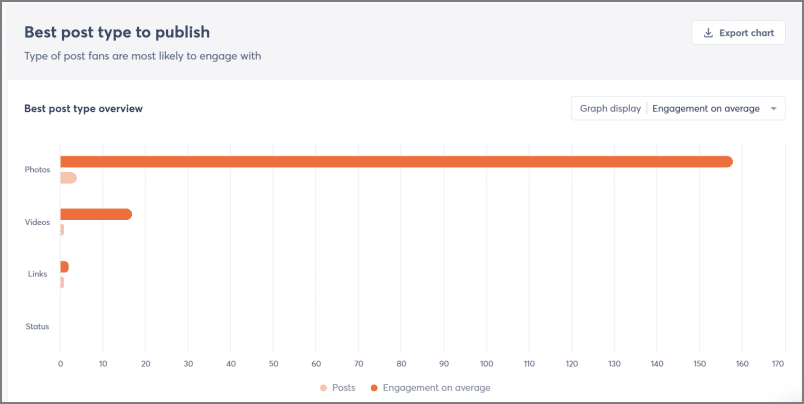
How to analyze: Respond to the engagement trends in these graphs. Take a twist on “doubling down on what works” by testing variations of your top-performing content. For example, if your how-to videos perform well, try different formats or lengths to optimize further.
Identify underperforming content types and either improve them based on what your data shows is working or phase them out entirely.
Find out if your posting schedule needs adjustment
Review the Best Day and Time to Publish section of your content reports to learn when your audience will most likely engage with your content.
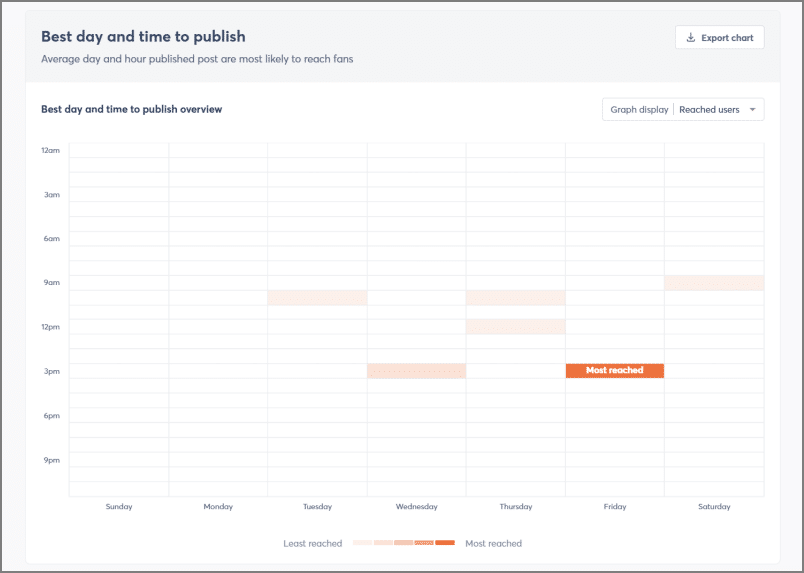
How to analyze: Do you typically post content on Fridays at 3 pm? Use this information to schedule (or continue scheduling) your most important content during these peak engagement windows.
Compare past performance to measure growth
Comparing performance over time helps you understand if your social strategy (and strategy adjustments) succeeded during this period.
The Audience report displays follower growth alongside engagement metrics, giving context for this expansion.
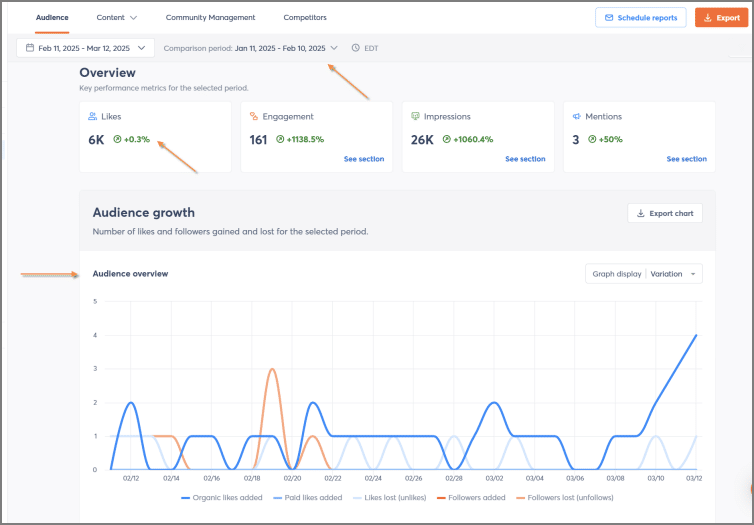
How to analyze: Take this information to find correlations between content strategy changes and audience growth patterns. Did, say, that new social proof campaign coincide with faster follower acquisition?
Monitor month-over-month (MoM) engagement rate changes to see if your growing audience remains equally responsive to your content. If that social proof boosted your audience size, what new content can you create to attract a similar percentage of MoM followers?
Benchmark your social media performance
It’s a great idea to compete against your past performance. But it’s equally, if not more, important to measure your success against your competitors.
The data from Agorapulse’s Competitor Reports lets you see where you outperform or fall behind competing tools in your marketplace.
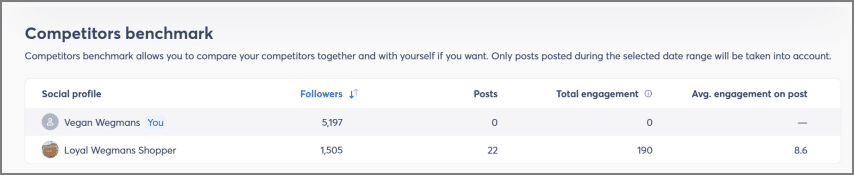
How to analyze: When you see competitors outperforming you, study those metrics to determine what you might adapt to catch up (or zoom past). Don’t forget to share your competitive social success with the C-Suite!
Use community management metrics as training opportunities
Agorapulse’s Community Management reports give valuable insights about team performance. Data here includes responses and average response time per teammate.
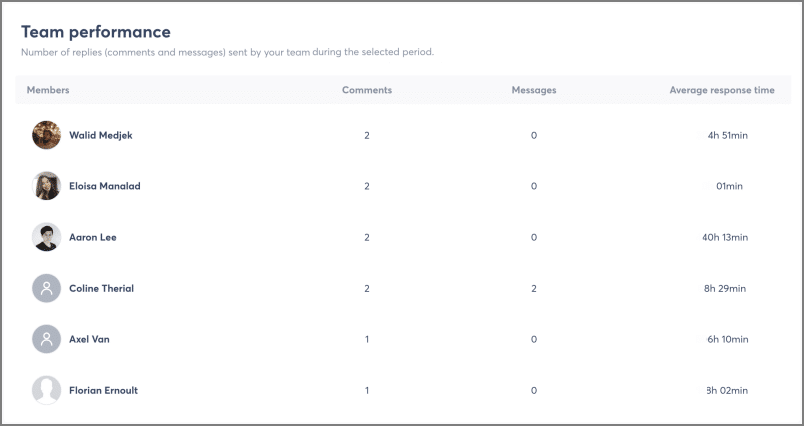
How to analyze: If someone on your team falls below the team average response time, find out what might be slowing them down. Consider additional training for them to increase their performance.
Collaborating with Your Organization Using Reports
Sharing social media analytics with your organization improves cross-functional communication. These reports also show your team’s commitment to tying social content to larger business objectives.
The data and analysis in the reports are also kind reminders to your colleagues, especially those who still don’t get social, that you’re not on an island in a lounge chair creating cat GIFs all day. Let these reports show them that you’re working hard each day to hit company-wide goals.
Putting reports in greater context
Reports to your stakeholders shouldn’t be sent without some commentary. It’s in your best interest to add a few words to encourage folks to read the report and see the value your social team brings to the company.
If you send reports manually via email, Slack/Teams, or an internal Wiki page, highlight the key takeaways and explain your recommendations based on the data.
For automated weekly or monthly reports, set a reminder to follow up with stakeholders to point out 1-2 key insights they should focus on in each report.
Three Common Challenges and How to Overcome Them
Social media reporting presents three main obstacles for most teams. Here’s how to tackle each one:
Challenge 1: Data overload
Most social teams can access tons of raw analytics. But they don’t know how to distill the most meaningful numbers to analyze and share.
As a result, many marketing teams waste hours each week reviewing statistics that never relate to their content strategy or influence business decisions.
Solution: Build a metrics pyramid
- Select 2-3 primary metrics tied directly to business goals
- Choose 4-6 supporting metrics that explain performance changes
- Cut metrics that don’t connect to business results
Challenge 2: Inconsistent reporting
Inconsistent formats and timing prevent stakeholders from tracking progress effectively. When report designs and delivery schedules constantly change, team members struggle to identify patterns, and executives lose confidence in your professionalism.
Solution: Standardize your approach
- Create templates for each report type with consistent metrics. Agorapulse offers reports in PDF, PPT, and CSV formats. Pick the format that will work best across teams.
- Define precisely what each measurement includes across platforms
- Schedule automatic delivery for predictable timing
Challenge 3: Team accountability
Reports become a chore when ownership remains unclear. Without assigned responsibilities, reports often arrive late, contain errors, or lack the analysis to drive strategic decisions.
Solution: Establish clear roles
- Assign one person as the reporting owner
- Distribute analysis responsibilities based on expertise
- Create a system for turning insights into action
With clear metrics, consistent systems, and defined responsibilities, your team can transform social media reporting from a draining obligation into a powerful decision-making tool.
Moving forward with social media team reporting
Effective team reporting tracks meaningful numbers that validate your social investment, guide resource allocation, and align your efforts with business goals.
Agorapulse’s reports deliver clear, customized metrics to everyone who needs them, saving hours of manual work each month.
See the difference solid reporting makes. Start your free Agorapulse trial today.


")