How do you know people like what you tweet?
A simple measure, of course, is to check to see how many people hit the “like” or “retweet” button on each of your tweets.
If you go by those measures alone though, you most likely aren’t seeing the big picture.
Let’s take a deeper look at your Twitter analytics, something that many of us rarely do — but need to.
Twitter Analytics 101
If you’ve never ventured to the analytics dashboard of your Twitter account, you will first need to know how you can access your Twitter analytics. You can get to that dashboard two different ways.
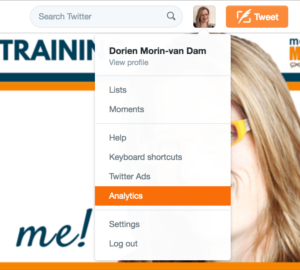
If you are already logged into your Twitter account, click on your profile image (top right-hand side of the home page) to reveal a drop down menu where you will find your analytics listed. Click on ‘analytics’ to get to the dashboard.
Alternatively, you can use this URL to access your analytics directly at analytics.twitter.com.
You will need to log in to see your stats; use your Twitter log in details to do that.
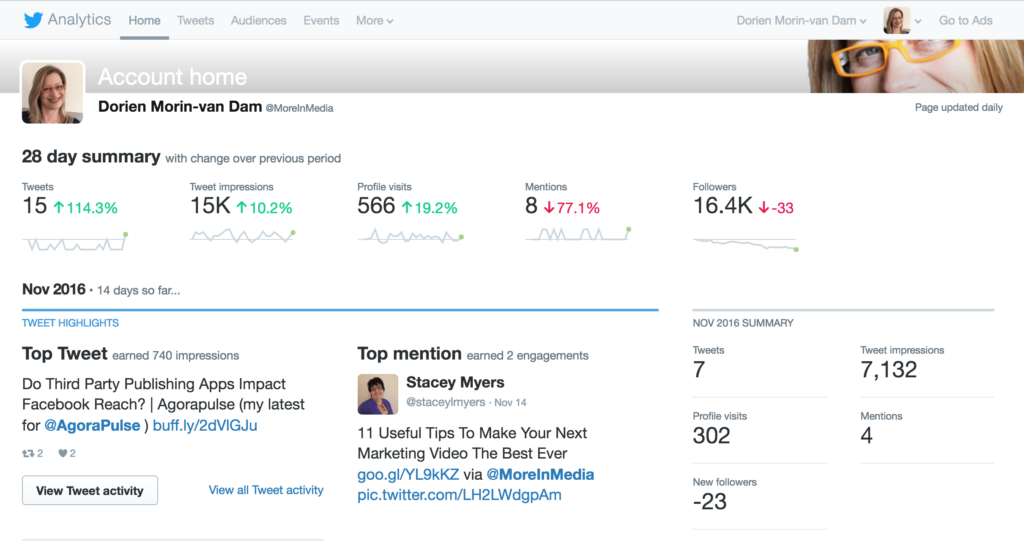
Once you are on the dashboard, the first thing you will see is a 28 day summary report.
[As you can easily tell from my profile, I haven’t been very active (thus far) this month!]
If you keep scrolling down, you will see the more reports, segmented to each month. This is a useful way to instantly see your monthly activities, your most-talked about tweets , your tweet frequency and the engagement your tweets have been getting.
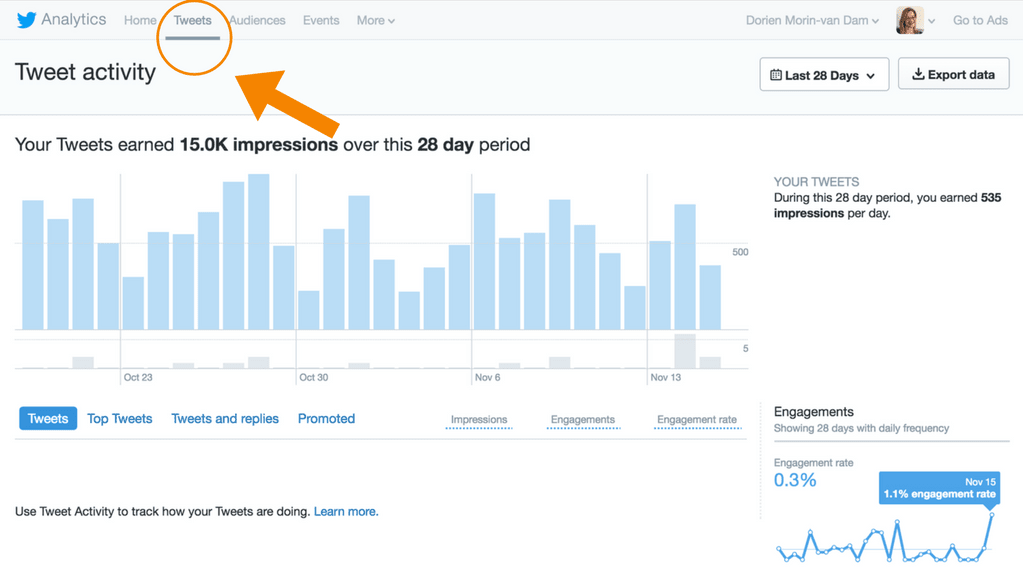
Next, click on ‘Tweets’ to open a new dashboard.
From this dashboard, you can dig into the analytics of each tweet.
You can select (by clicking on the appropriate link) to look at your
- Tweets
- Top tweets
- Tweets and replies
- Promoted tweets
and then receive the following information about each tweet:
- Impressions
- Engagements
- Engagement rate
Once you dig deep in these numbers, it will become apparent which one(s) of your tweets stink!
I get it though. Not all tweets are created equal and not all tweets land on fertile ground. Often I will create something I think will do well with my audience, yet it was like I was talking to no one all and all I heard was…
It’s frustrating and I bet many of you can relate!
There is a solution, of course: Learn more about your audience so you can craft the perfect tweet for your ideal target audience and post it at the most opportune time.
Create Tweets Your Audience Loves
Once you’ve discovered which tweets stink and which tweets did well, try to recreate some of your more successful tweets. But before you do that, you will need to go look at your Twitter Audience to make sure you will continue to hit the mark with your most engaged audience members.
Your question should be: Am I reaching my intended audience?
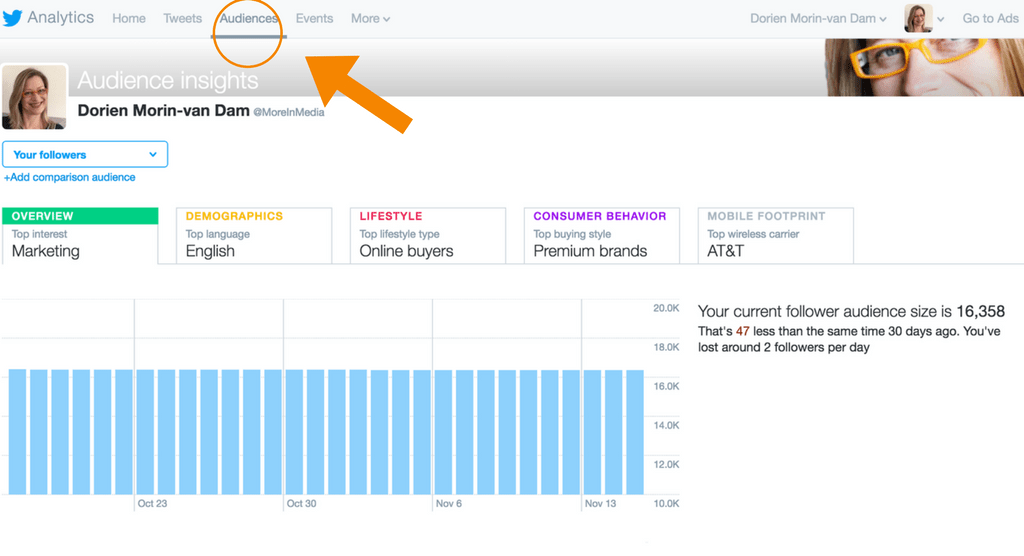
On your audience dashboard, you can find information regarding your current audience including information about
- Top interest
- Demographics
- Lifestyle
- Consumer behavior
- Mobile footprint
Keeping your audience in mind, including their top interests, their preferred language, their lifestyle and their buying style, you should be able to more accurately craft your tweets for that intended audience.
A Dashboard That Goes Beyond Twitter Analytics
Wouldn’t it be great if you could analyze your latest tweets, all the while monitoring your Twitter account for engagement and then craft new tweets based upon the latest analytics and schedule these new tweets all in one place?
Yes, you can! You can do all that (and much much more for other platforms besides Twitter) in the Agorapulse dashboard!
Time is money for busy business owners, and their social media managers, and Agorapulse understands that better than most.
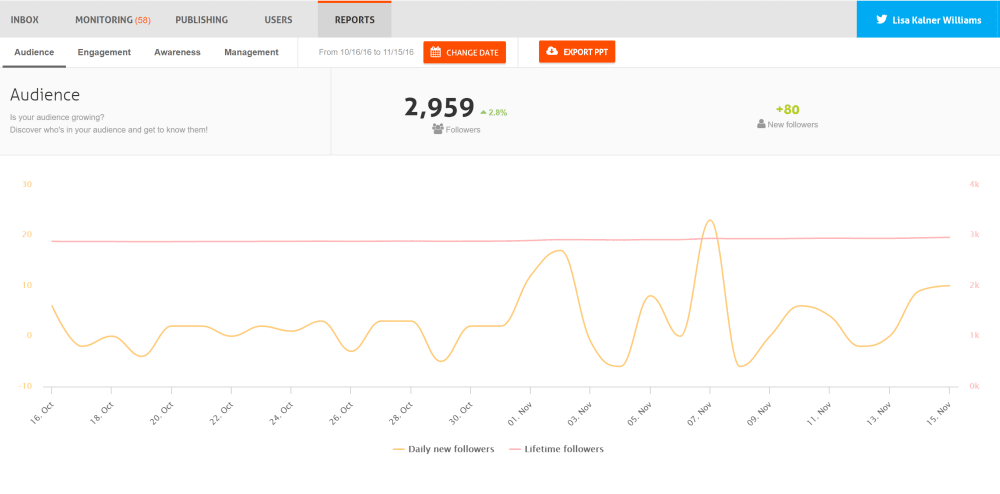
This is my Agorapulse dashboard.
On the left (blacked out) is where I select the account I want to access. Once I select the account I want, a new dashboard is opened for that specific social media account. In this example I selected my Twitter account (see #1 in the above image).
Then for that account, I can access
- inbox
- monitoring
- publishing
- users
- reports (#2 in the above image)
Once I selected reports (#2) I can access analytics on
- audience
- engagement
- awareness
- management
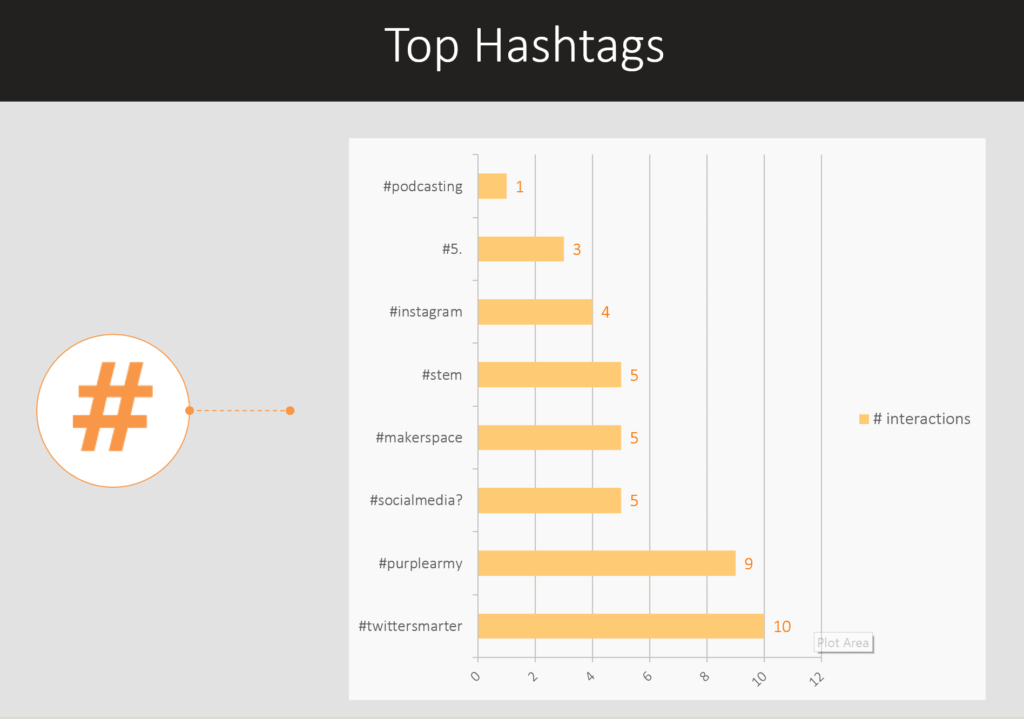
I can also select what date range I want to see in my dashboard and I can even export the PowerPoint analytic files to create reports! Here’s one slide of the PowerPoint deck that tells me how the hashtags on a particular account performed the past 30 days. (You can customize the time frame to other spans of time too.)
All Social Media Analytics In One Place
Did I mention that with one dashboard, I can access the analytics for nearly all of my social media accounts? That includes analytics for all of my Facebook Pages, and Twitter and Instagram accounts!
I don’t know about you, but anytime I can save time and do my job better, that’s money in my pocket!
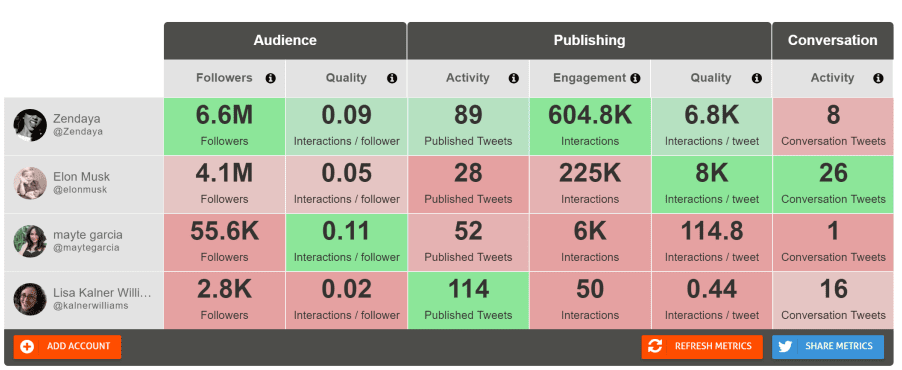
Seize Up The Competition with the Twitter Report Card
Back in July Agorapulse posed the following question: Can Twitter Analytics Predict a Trump v. Clinton winner?
The idea that social media could decide the 2016 election has been talked about since the campaign began. While social media existed in the 2012 debate, the past four years have seen exponential growth in terms of engagement and capability. If 2008 was the “Facebook election,” 2016 could very well become the “Twitter election.”
It sure looks like this predication and the Twitter Analytics was right on the nose.
If you’re looking to analyze competitive Twitter data, try the same tool that was used in this Trump v. Clinton article — the free Twitter Report Card.
What Twitter analytics do you rely on for your business? Let us know in the comments!

