In regards to popularity rates, new content, and engagement metrics, YouTube is in a league of its own. This video-focused platform is the most widely used social media channel by a long shot, with a user base that includes over 80% of American adults. YouTube’s biggest channels produce nearly 50,000 hours of content and attract over 14 billion views per week.
Whether you manage one of the platform’s biggest content producers or your channel is just beginning to gain steam, you need a way to monitor progress and success.
After all, you’ve got a lot of competition.
Let’s look at the YouTube metrics that matter most, so your team can set benchmarks and reach your goals. (And beat the YouTube algorithm, too!)
Why YouTube Metrics Matter
Is YouTube your brand’s primary social media channel or just one aspect of a complex digital marketing strategy?
Either way, monitoring the right YouTube metrics is critical for the following.
Benchmark performance
Before your team can set and achieve goals, you need to know what’s typical for your brand.
Monitoring YouTube metrics lets you benchmark performance to give you a better sense of what’s possible and help with identifying trends in your results.
Improve performance
Every social media manager wants to do better and get more out of YouTube. But how do you know if you’re actually reaching that goal?
When you track metrics and compare them to previous periods, you can easily tell if your YouTube channel’s performance is improving, declining, or plateauing.
Analyze costs
Shooting, editing, and producing video content is far from free. So why bother wasting money on video content that doesn’t get the results you want?
When you monitor metrics, you can understand what’s delivering the most value.
You then can do more of what works.
Measure return on investment
Which videos generate the most value, and how do those numbers compare to your investment? When you track the most important YouTube metrics, you can ensure that your team spends money wisely.
You can then share compelling insights with stakeholders.
Build a social media funnel
Like all the content your team produces, YouTube videos are integral parts of a social media funnel.
Monitoring metrics can help you identify which videos are most effective for viewers at various points in the buyer’s journey. Your team then can build a more effective funnel.
YouTube Channel Views
Tracking YouTube channel views is a great way to monitor brand awareness, a key top-of-the-funnel metric.
If you’re like most YouTube channel managers, at the very minimum you want to attract more users every week or month.
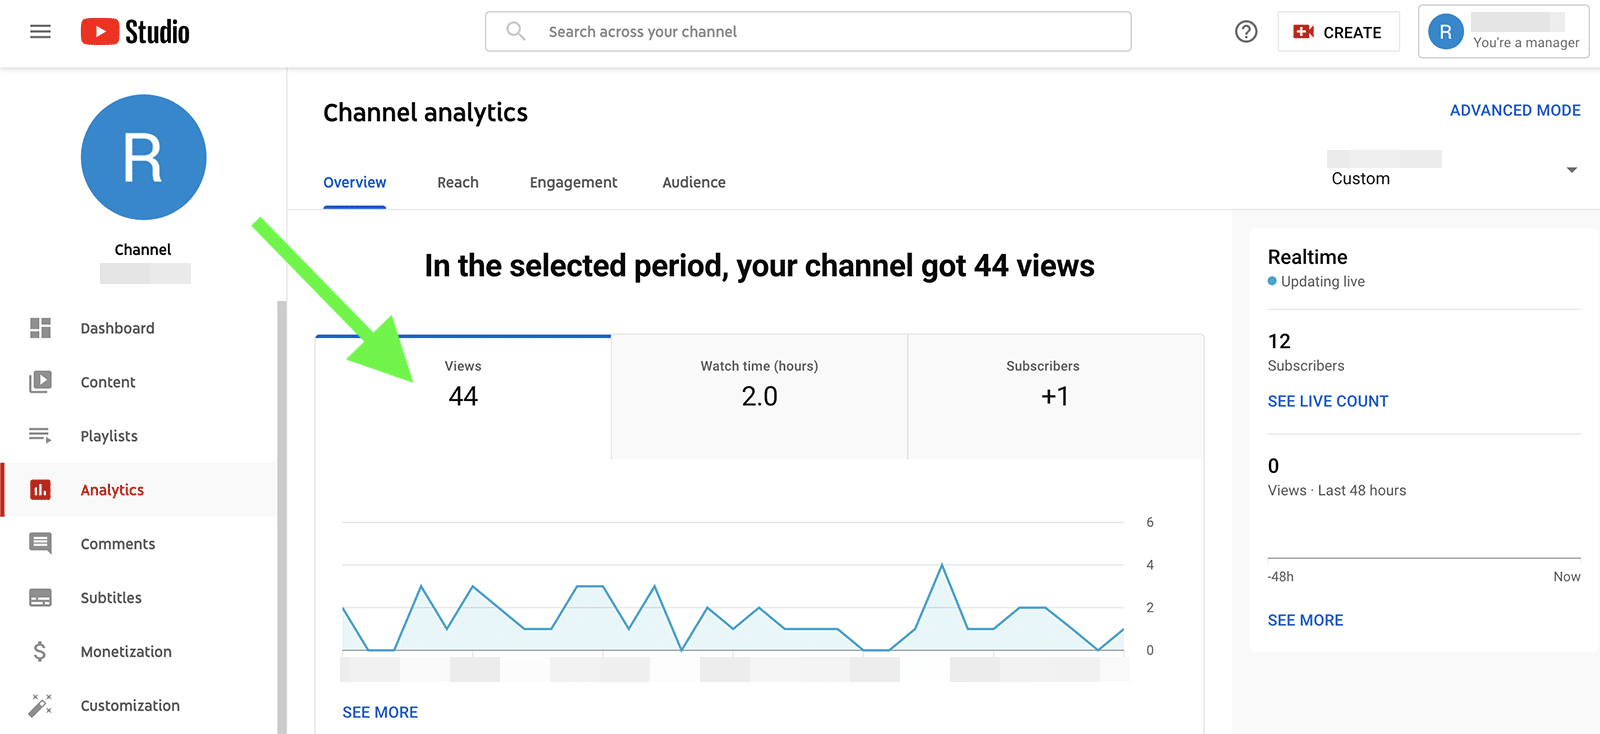
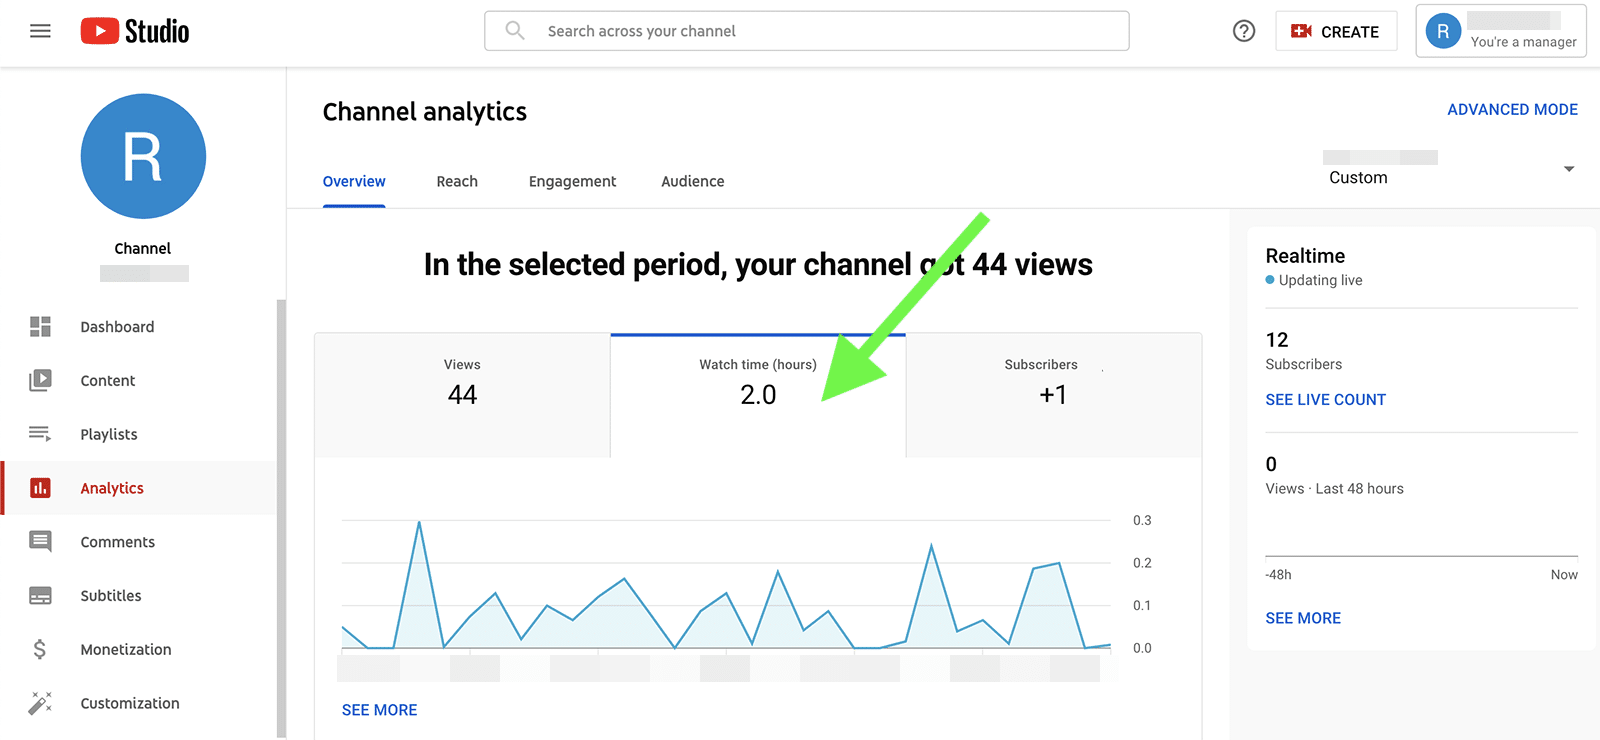
To find your channel views, navigate to YouTube Studio. You can find channel views on the main YouTube channel analytics dashboard.
In addition to a total count for the time period, the graph breaks down channel views by day. That way you can quickly identify days with traffic spikes and dips. Then you can start figuring out how to get more views on YouTube.
YouTube Subscribers
Is your brand’s YouTube channel gaining more followers? Or do your views come from casual viewers who weren’t interested enough to subscribe?
You can get answers to those questions by tracking subscriber metrics.
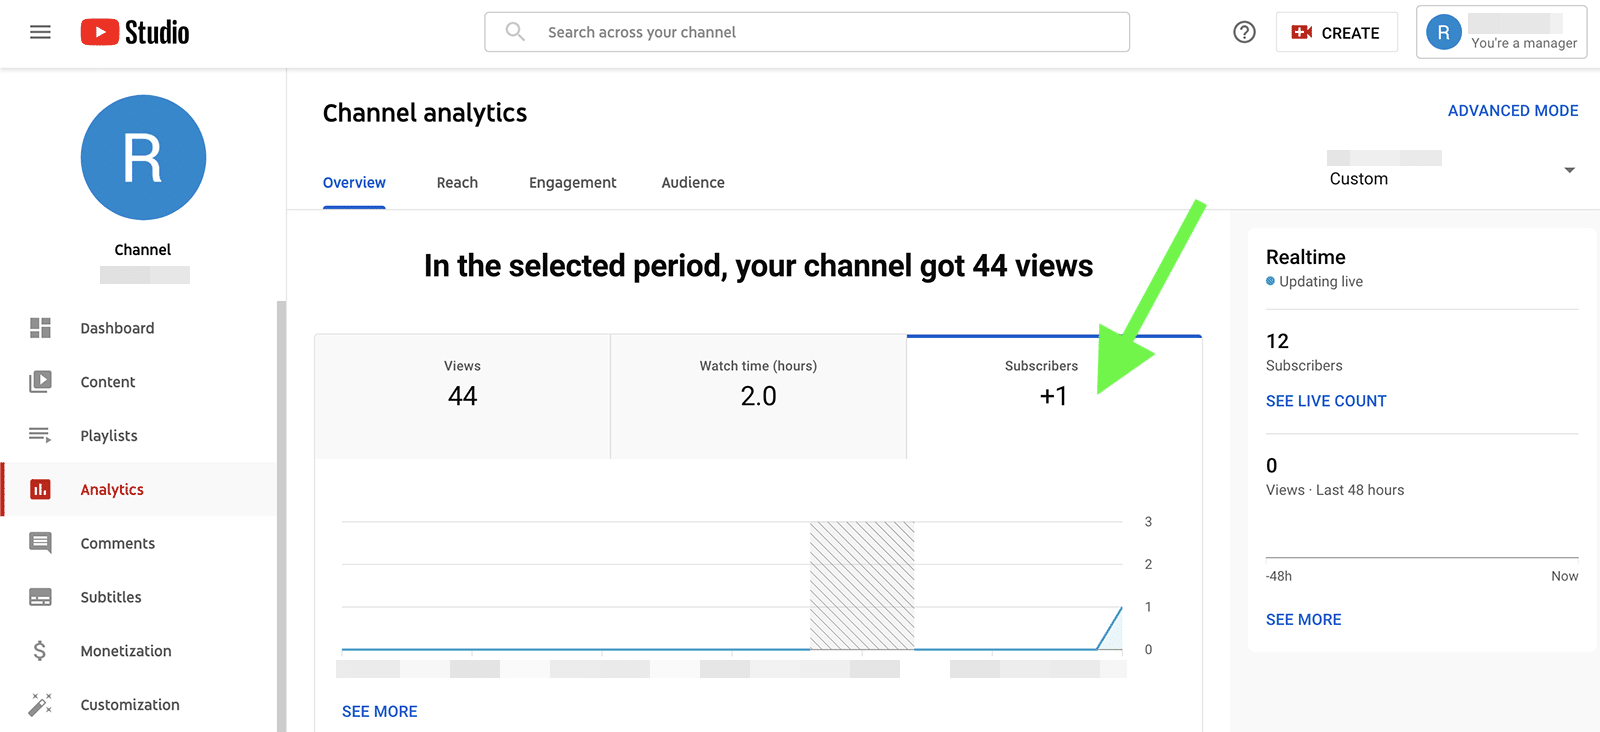
To check on subscribers, navigate to the audience panel of your YouTube analytics. Then click on the subscriber graph to see when your channel attracted the newest followers. Click See More to find out which videos attracted the newest subscribers so you can leverage them to grow your audience.
Unique Viewers on YouTube
In some cases, your team might prioritize getting more viewers to check out more content or even binge on your brand’s videos.
In other cases, your team may be more focused on attracting as many viewers as possible to boost brand awareness.
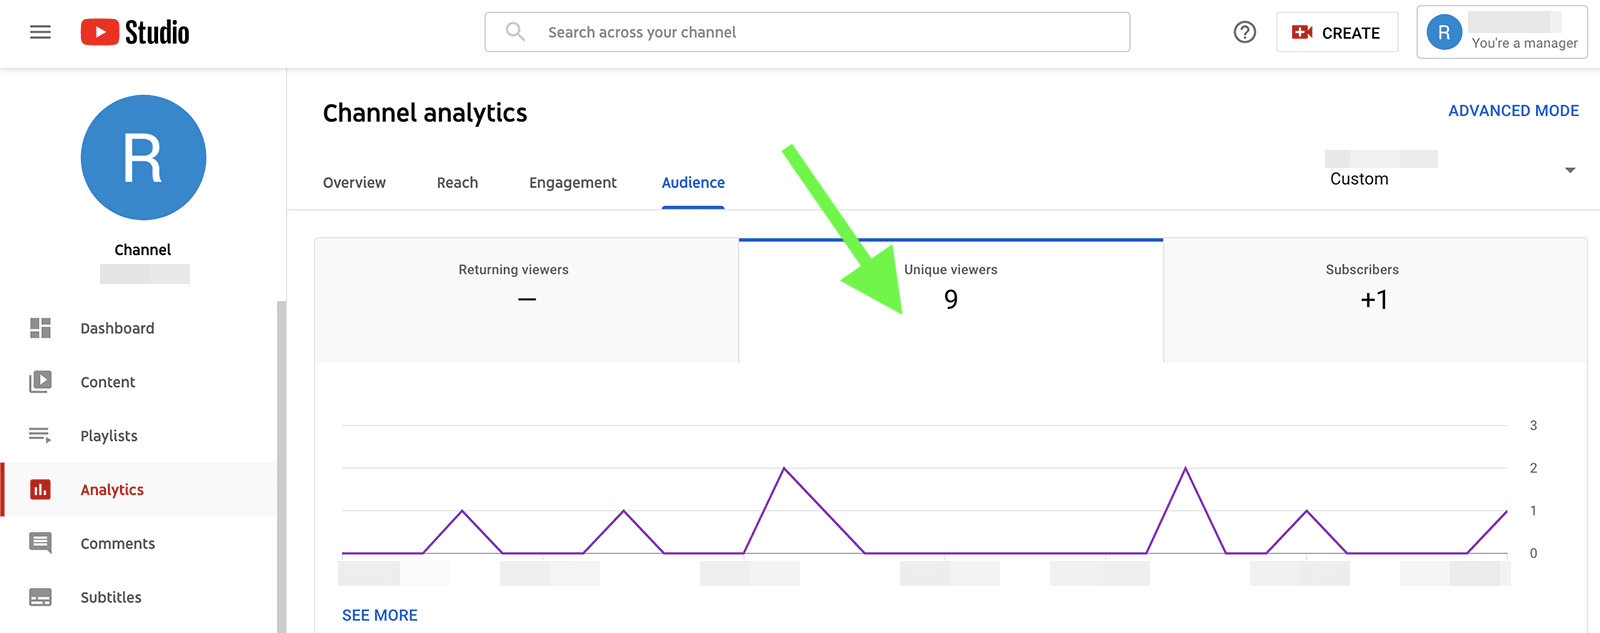
Either way, you can navigate to the audience metrics panel to measure the number of individual viewers during any time period. You can see a unique viewer tally for the time frame and a chart showing daily metrics.
YouTube Audience Demographics
Gaining new subscribers and more unique viewers is a good thing–as long as they fit into your target audience. Make sure you’re spending your YouTube marketing budget on an audience that drives value for your brand.
To get a closer look at your YouTube channel’s demographics, click on the audience analytics panel and scroll down.
You can access an audience breakdown by age and gender as well as a map of the most popular viewer locations.
If your business serves a local audience, you’ll want to make sure that the state-by-state breakdown matches your service areas. Click the See More link to track which videos drew the most unique viewers.
YouTube Impressions
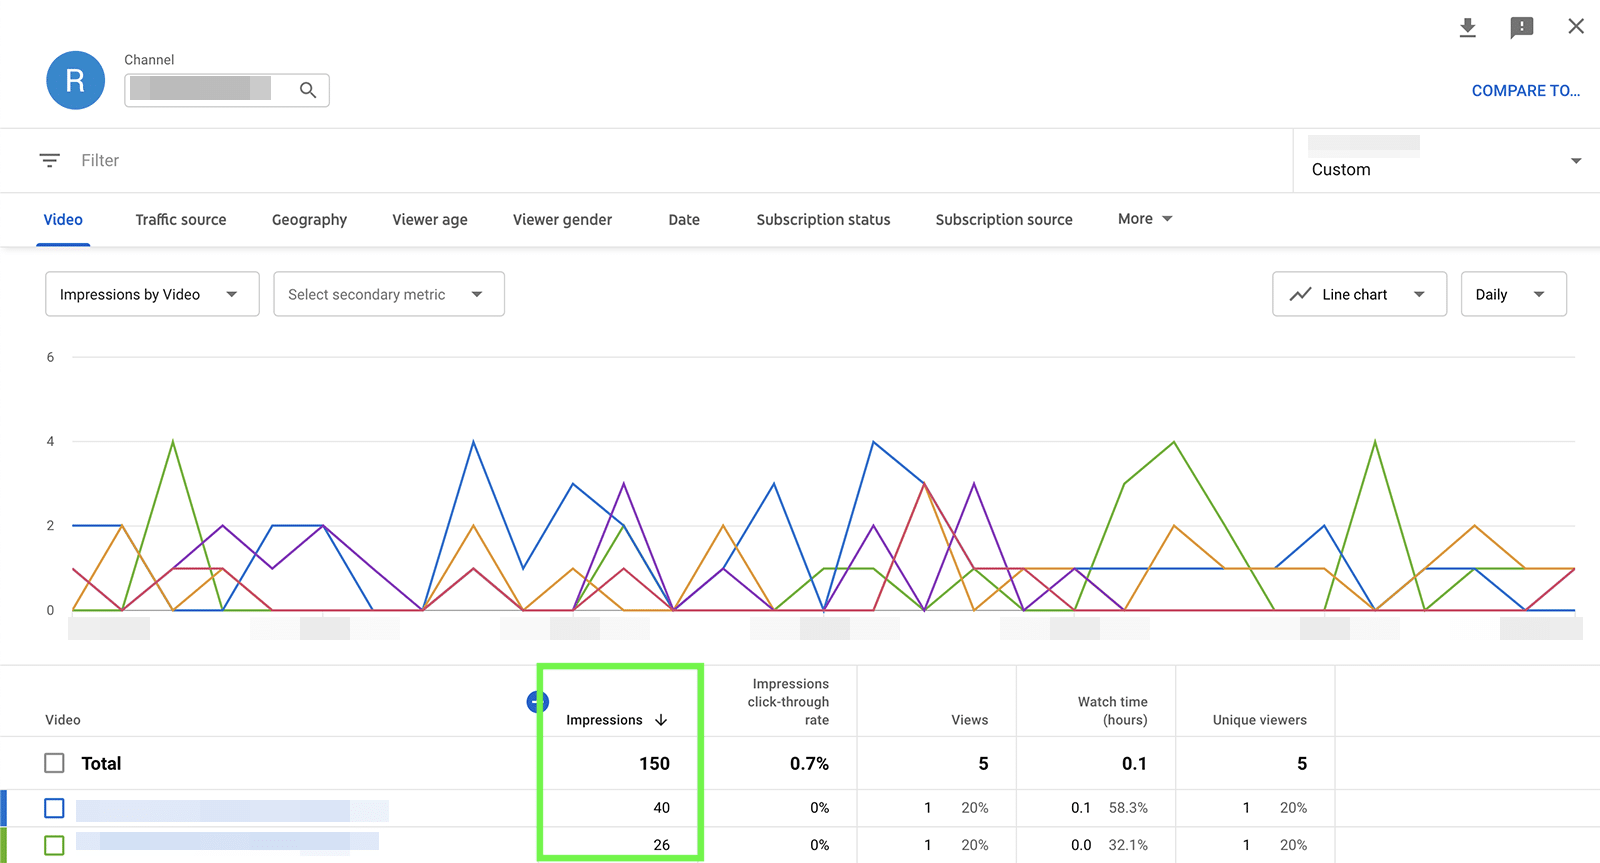
To get your brand on more users’ radar, increasing impressions is critical. More impressions mean more users saw your video thumbnails on YouTube, which can help your team gauge brand awareness.
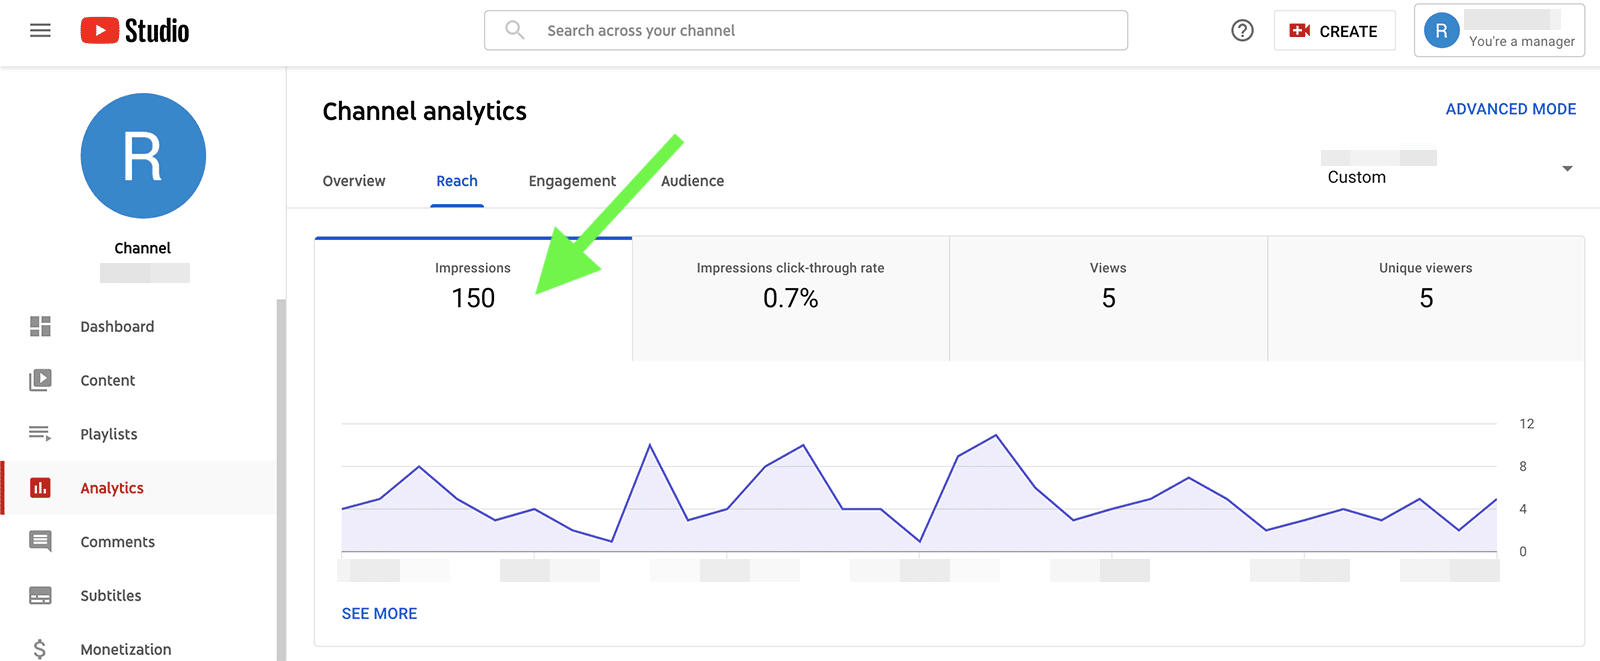
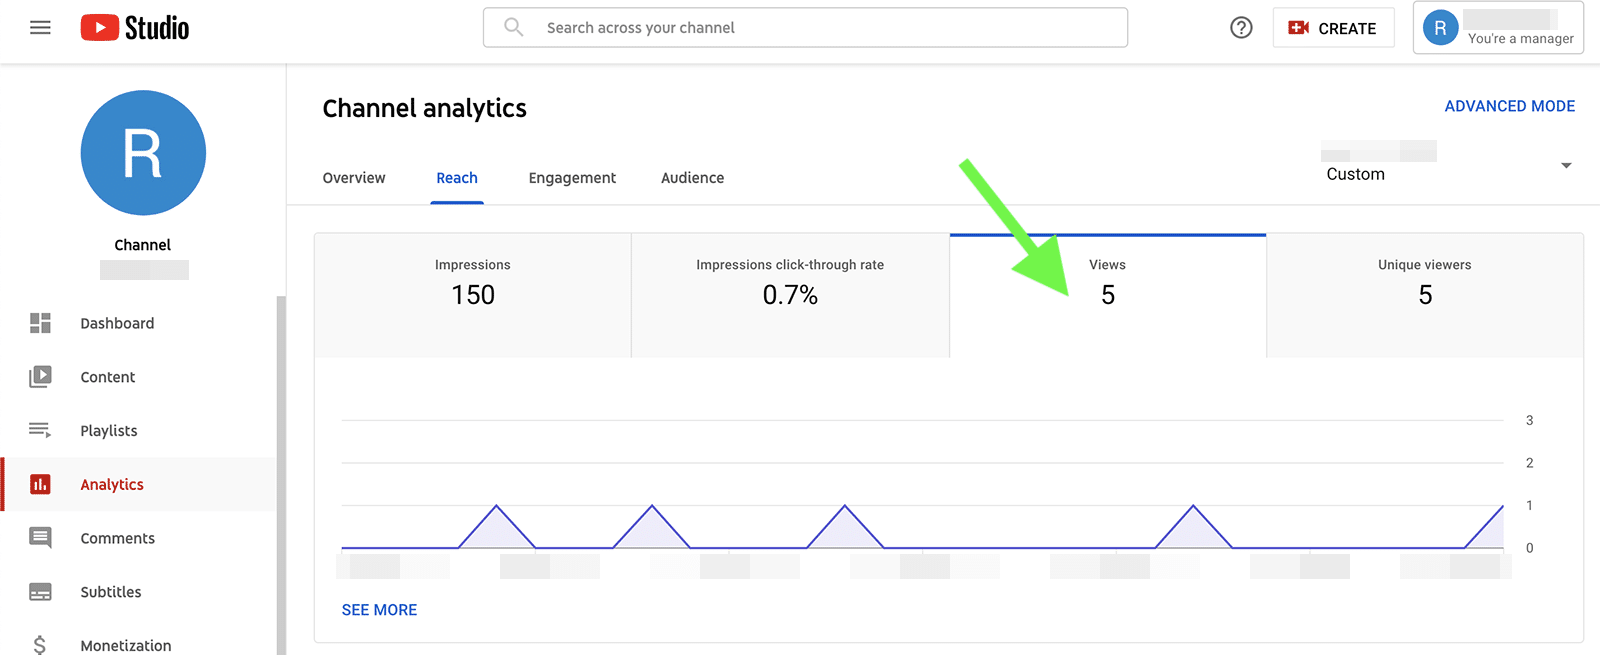
To see your channels’ impressions, click on the reach tab for a total. Like you do other YouTube metrics, you also get a daily breakdown so you can pinpoint when your channel received the most or least impressions.
If you spot unusual activity, click the See More link for additional details on each video.
For example, you can see which videos drove the most impressions on any given day. This data can help your team understand which videos are appearing most in searches or recommendations–which is essential for capitalizing on YouTube trends.
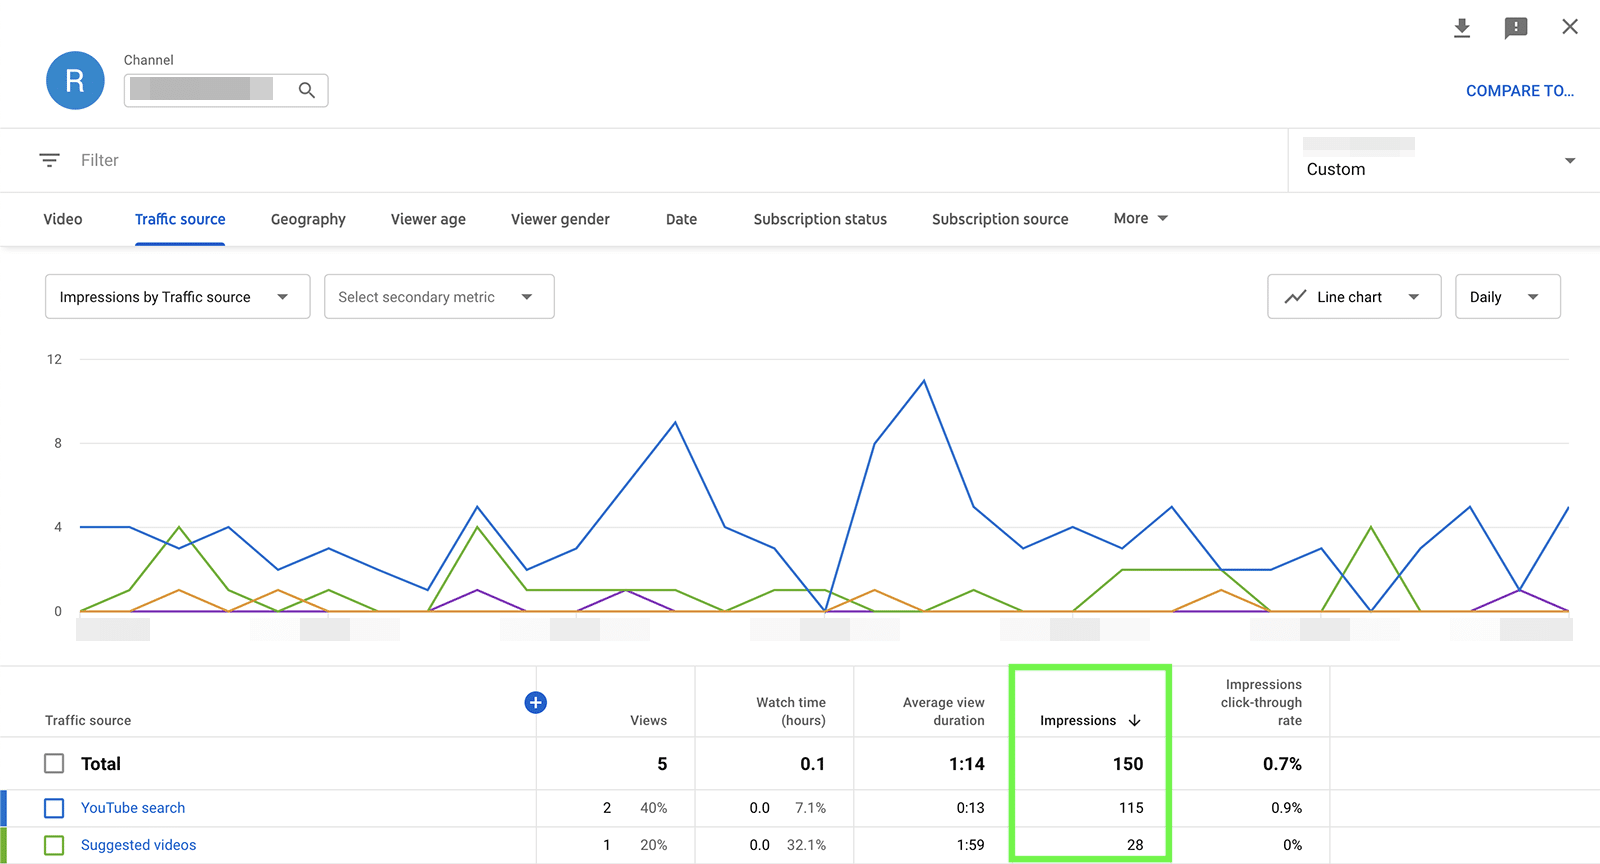
Click over to the Traffic source tab to find out exactly which of these avenues is driving the most impressions. The graph shows impressions from search, suggested videos, browse features, and your playlist page.
Impressions Click-Through Rate (CTR)
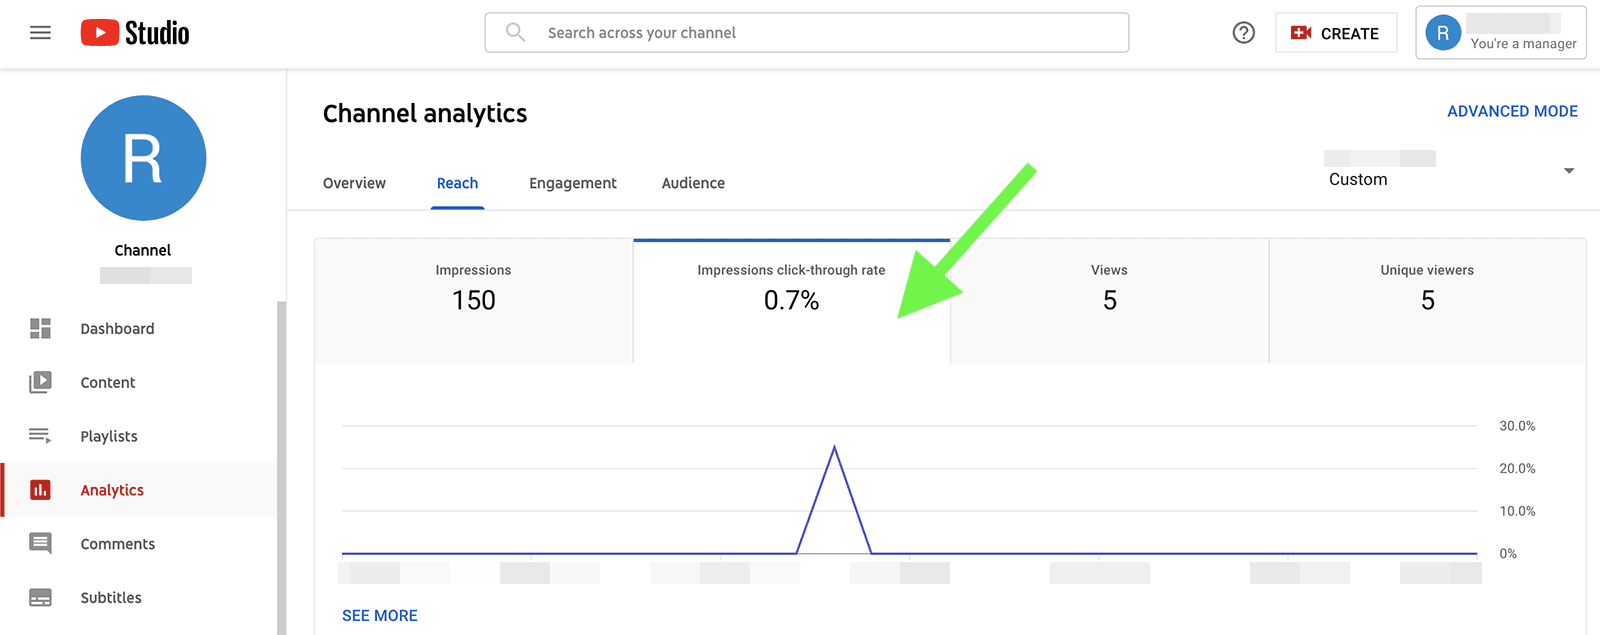
While monitoring impressions can help you measure how much your brand’s content appears on YouTube, measuring CTR metrics allows you to gauge interest.
A low CTR can indicate that your video thumbnails aren’t enticing users to click through and watch.
In contrast, a high CTR can reflect higher levels of interest in your brand’s content.
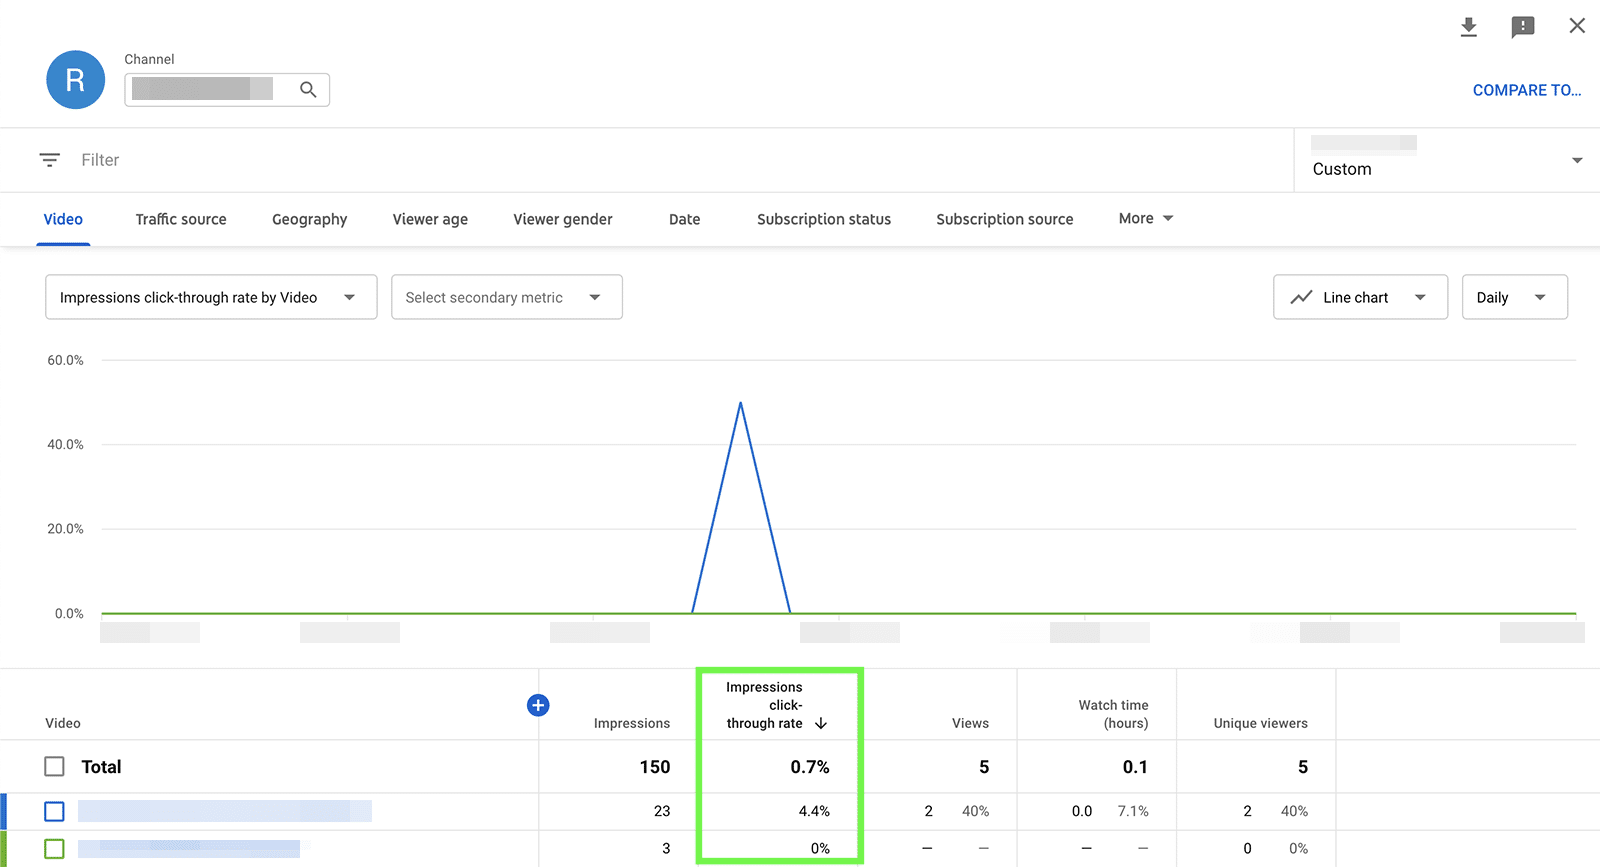
To see your channel’s impressions CTR, go to the reach tab. By default, it shows the CTR for the entire time frame, along with a daily average. Tap See More for a video-by-video breakdown of impressions CTR.
Do some videos have a substantially higher CTR than others?
Figure out why these videos are getting so much more traction than others and what that means for your brand. Does the added exposure mean more views and brand awareness? Or are the views leading to more engagement and subscribers?
Video Views
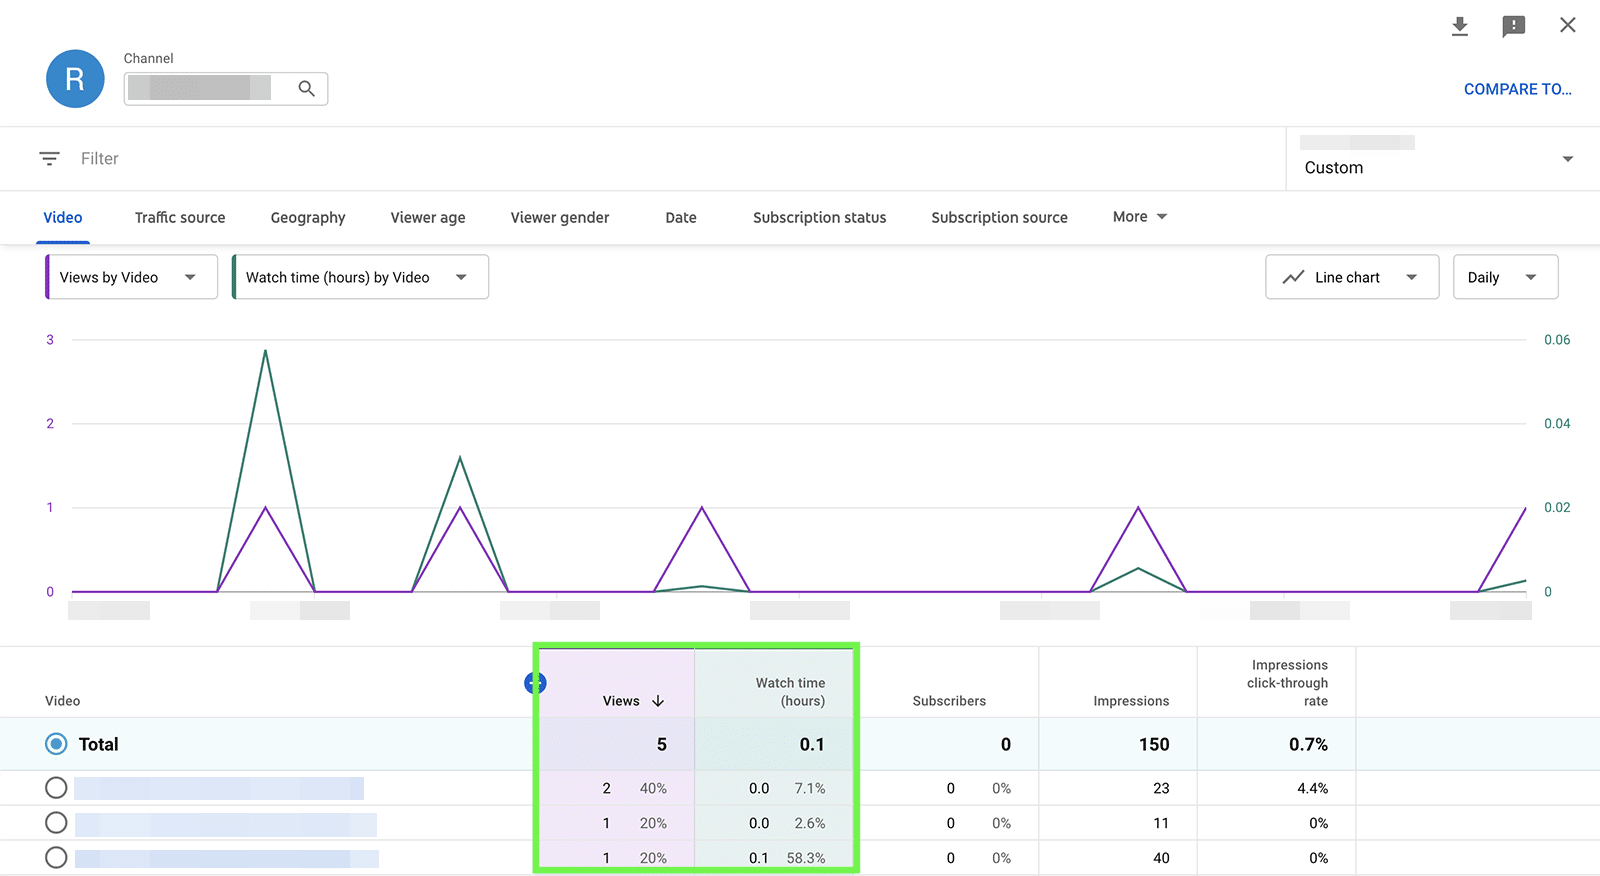
To figure out which content drives the best results, check video views on the YouTube analytics reach panel. Then click on the views tab to see a complete breakdown of views per video, including what percentage of total channel views came from each video.
YouTube analytics makes it easy to get more in-depth insights into your video content, too.
You can add a secondary metric from the dropdown menu to see how the number of views compares to watch time, for example.
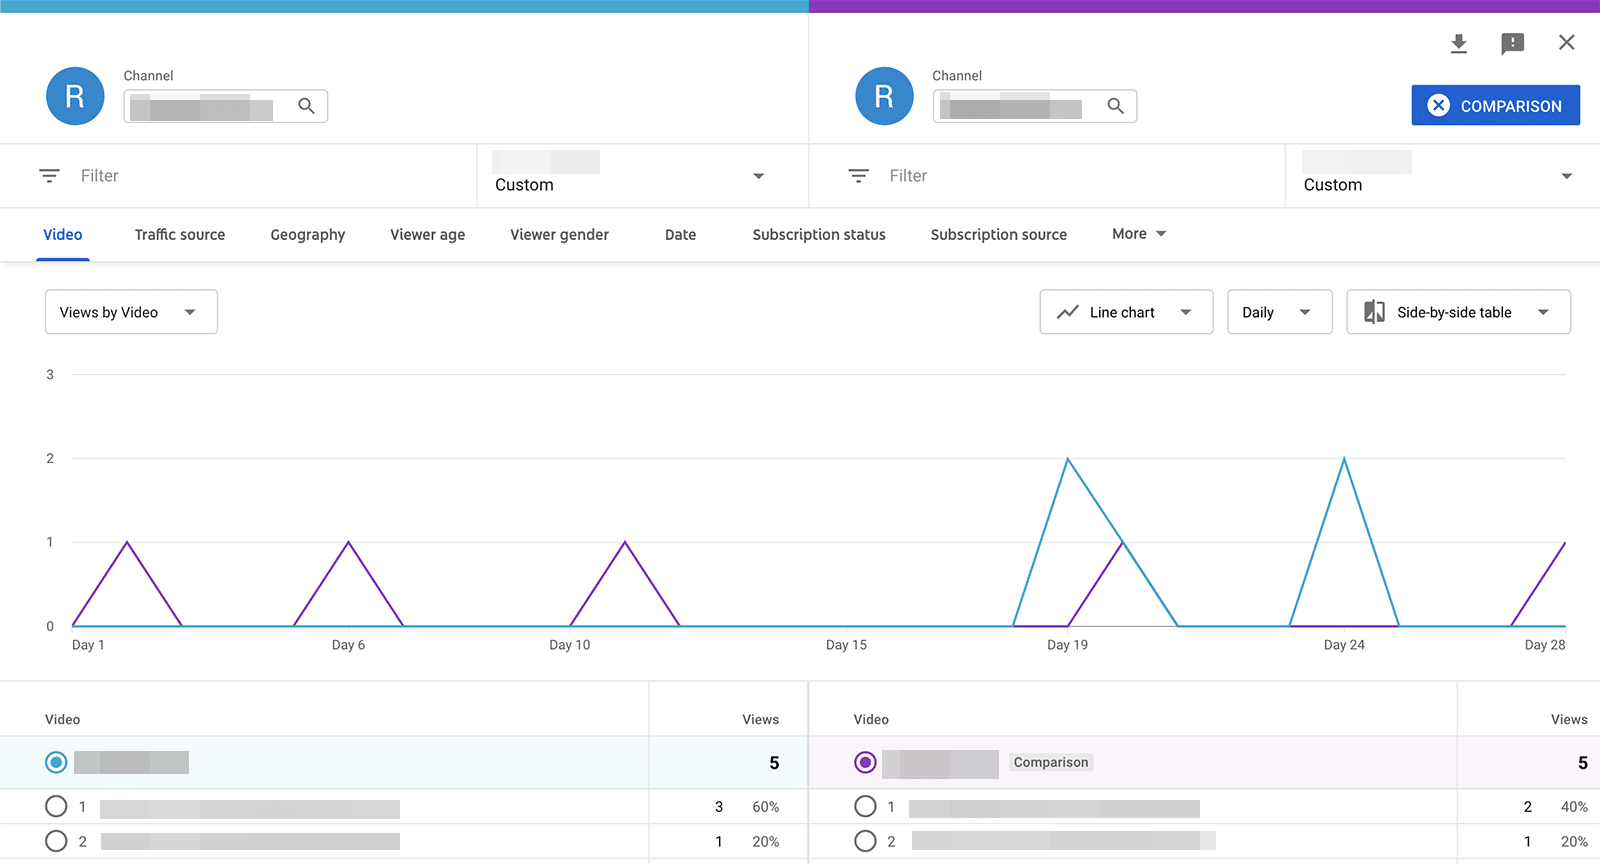
Alternatively, you can compare video views between any two periods of time. Select the time frame to compare–such as the previous week or quarter–to assess whether your channels’ performance is improving at the rate you’d hoped to see.
Top Videos
To optimize your YouTube strategy, you have to know which videos are performing best. YouTube Studio automatically highlights your top videos by watch time for any time frame.
To access this chart, go to the engagement tab and scroll down. You can see the top four videos with the most watch time and click the See More link for more top video metrics. Toggle the dropdown menu to sort top videos by impressions, CTR, views, or average view duration.
Check out these best practices for your YouTube marketing
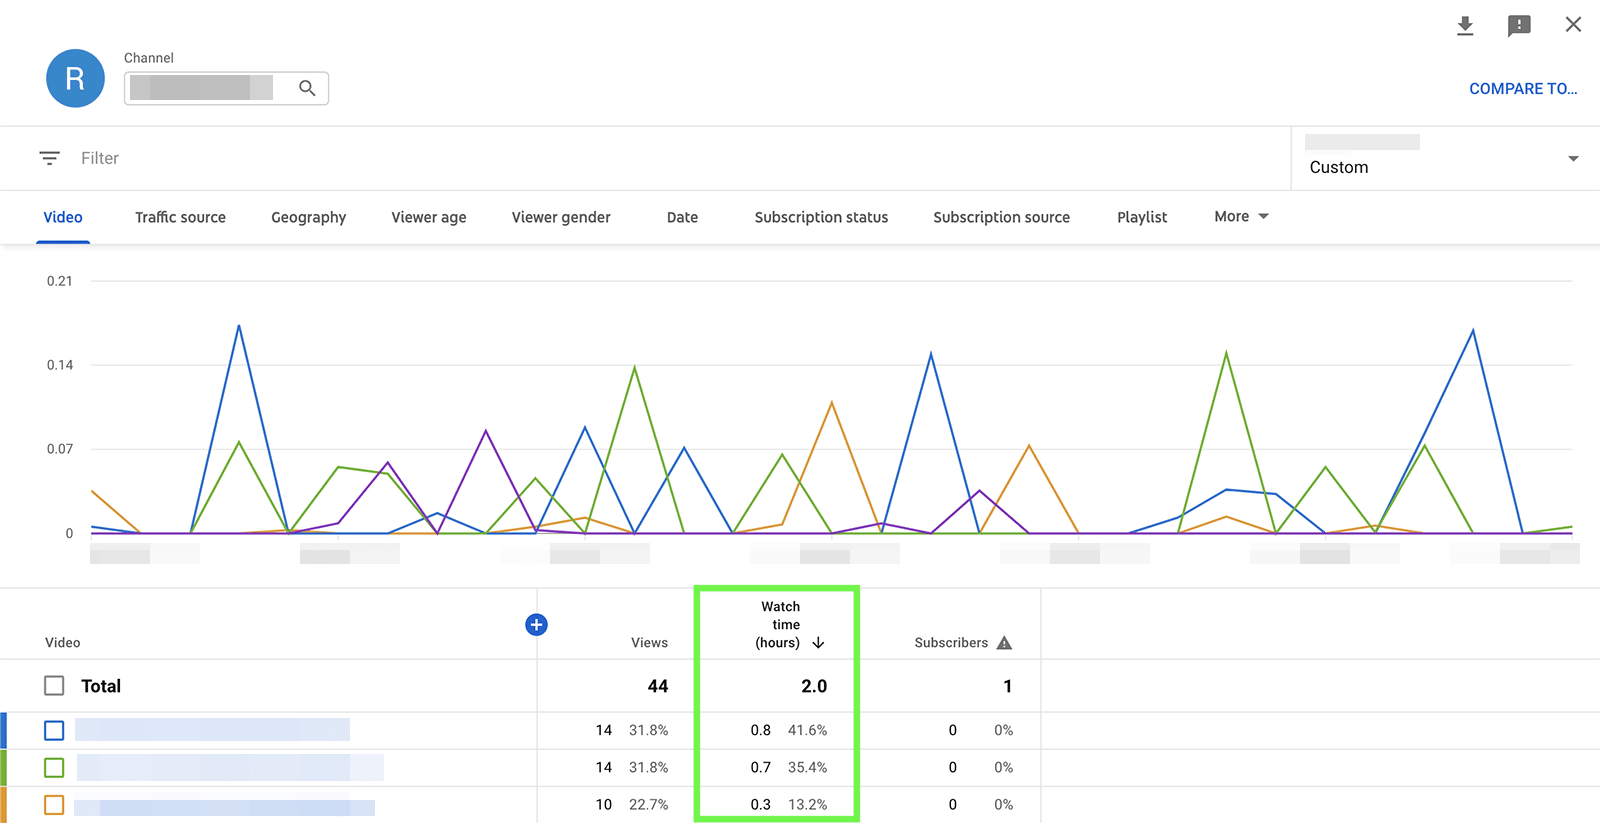
Watch Time
It’s easy to assume that a video view means a user has watched the entire production, from beginning to end. Because that isn’t necessarily the case, you need to monitor watch time, or how long users have viewed your videos.
YouTube analytics tracks watch time in the overview panel, where you can find the total amount of time users have consumed your content during the time period. The chart shows a day-by-day overview, so you can look for patterns.
Click the See More link to see individual watch time metrics for your video content. You can select one or more videos if you’re curious about comparing just the top performers.
Real-Time Views
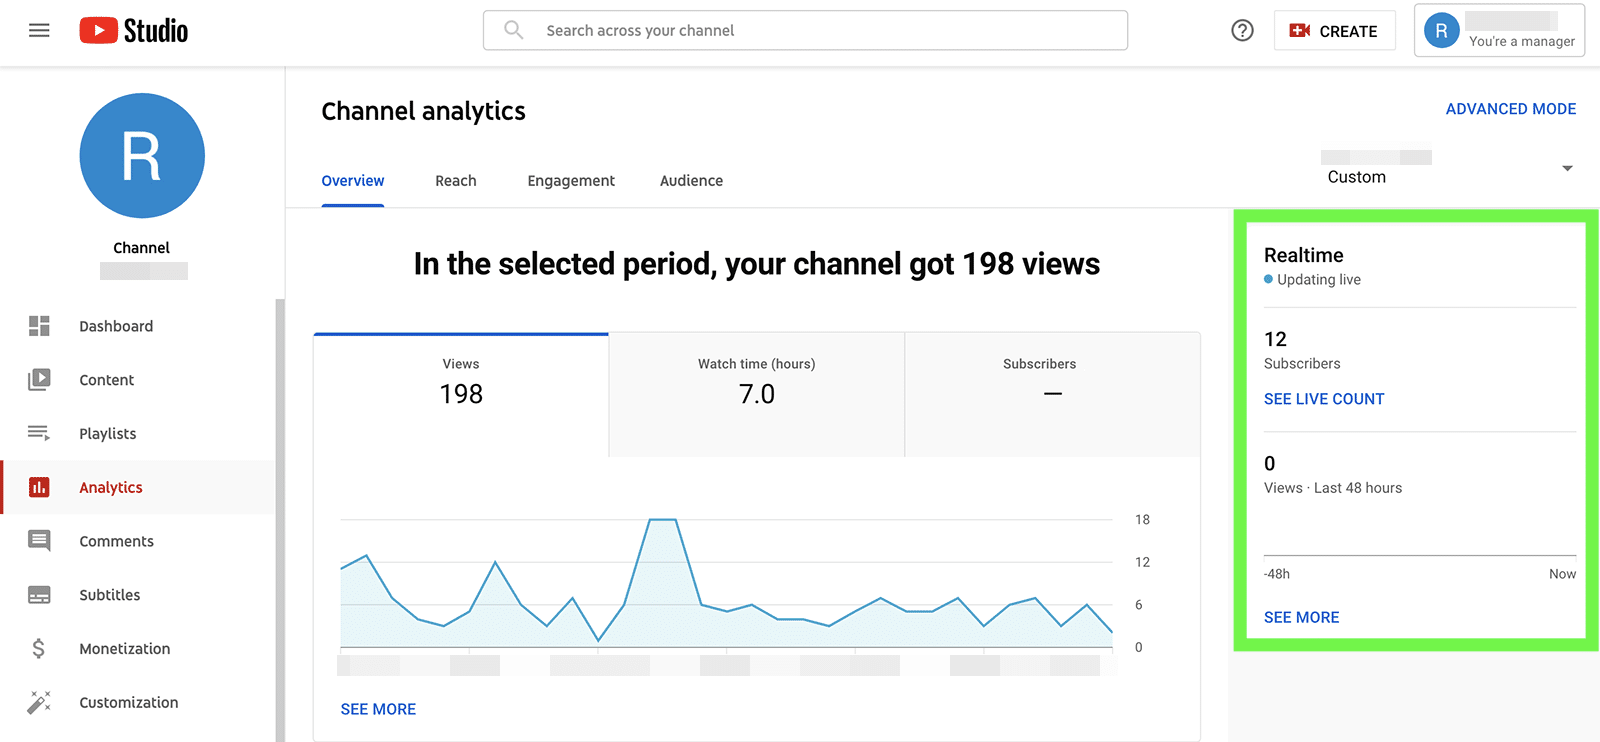
Maybe you just posted a highly anticipated video and your team needs frequent performance updates. Or perhaps you’re posting a ton of content around a big launch or event and you need to know how it’s doing. Either way, you can check YouTube’s real-time analytics to get up-to-the-minute results.
You can access real-time metrics from the overview panel, where YouTube automatically tracks video views and provides live updates. By default, the chart shows views for the past 48 hours so you can quickly assess recent activity.
Click the See More link to get a glimpse of views in the last 60 minutes and in the last 48 hours. YouTube also displays a list of videos with recent views so you can see what’s driving all the traffic.
YouTube Likes and Dislikes
Video views and view time metrics can help your team identify the most popular content on your channel. But most social media marketing teams also want to monitor how viewers engage with their content for a couple of key reasons.
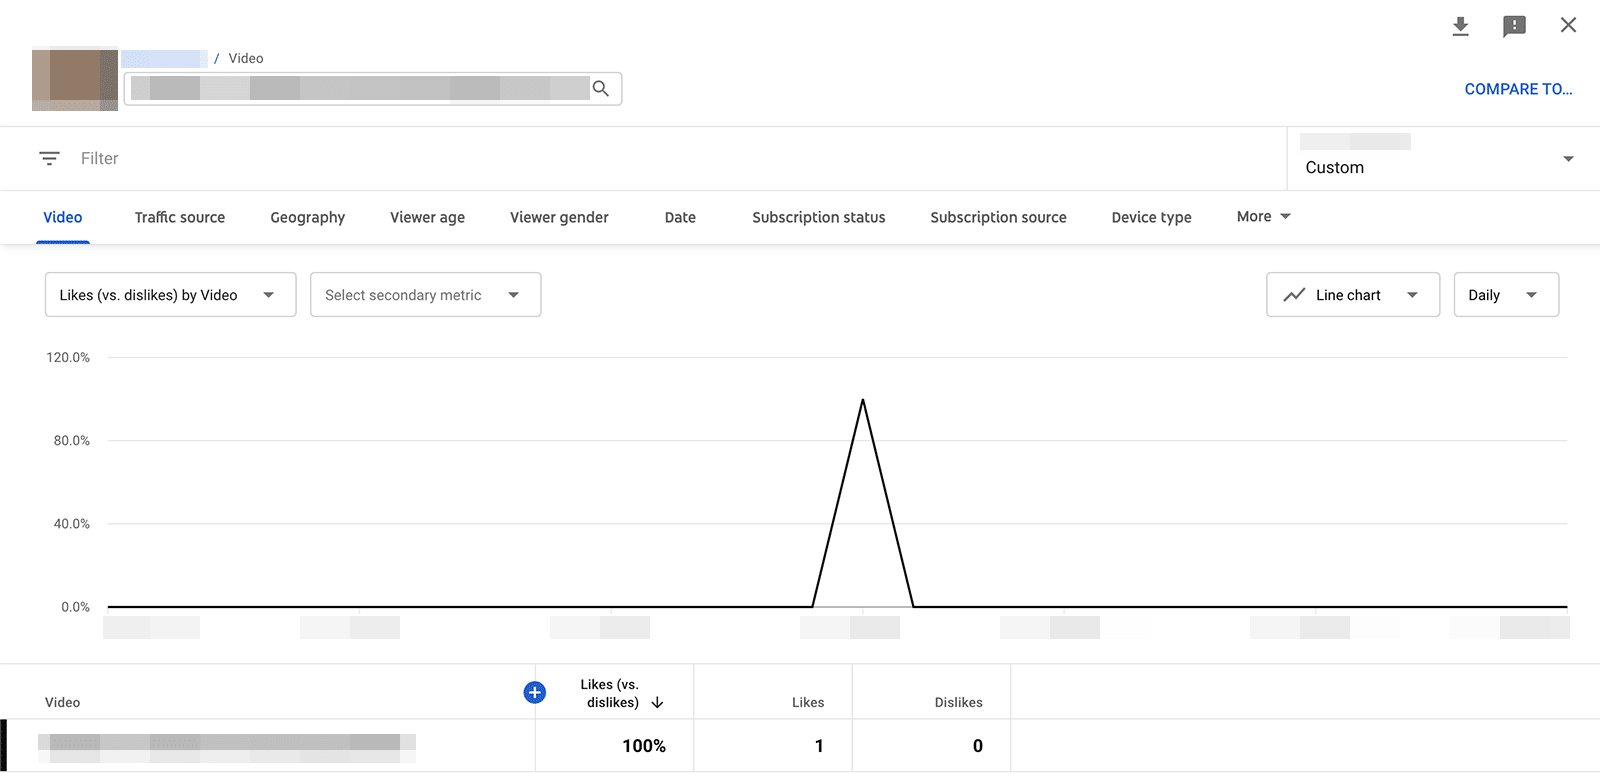
Monitoring likes helps you understand what type of content viewers appreciate and want to support. Likes are also one of the many factors that affect the YouTube algorithm, encouraging it to show your videos to more people.
To dive into engagement, go to your YouTube channel content library and click on any video. Navigate to the engagement tab and scroll down to the likes vs. dislikes counter, which shows how many of each the video received during the time frame. Click the See More link to see when users gave your content a thumbs up or thumbs down.
Audience Retention
No matter what kind of message your YouTube team wants to convey, you likely want viewers to watch as much as possible of any video. Otherwise, they might miss the message.
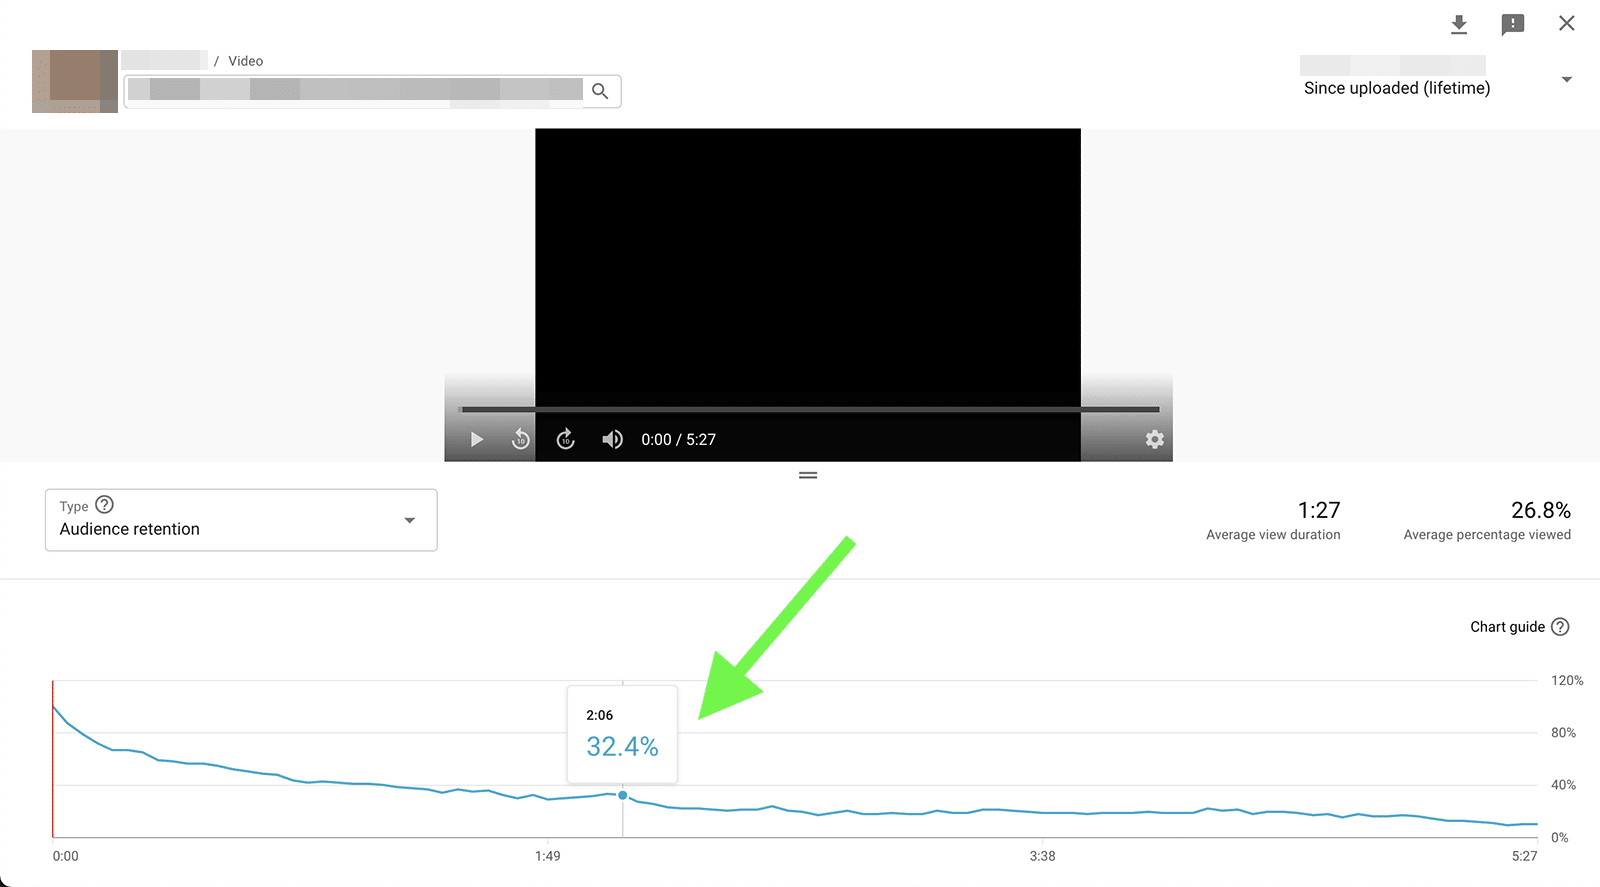
You can view audience retention metrics by going to the engagement tab for any video in your channel’s content library. YouTube automatically displays the average view duration and average percentage viewed since your team first uploaded the video.
Tap the See More link to get a more granular look at these metrics. You can see the percentage of people who viewed any amount of the video and identify times where viewers dropped off. Then you can use this data to better understand how to keep users engaged and how to produce more effective content in the future.
Top Playlists
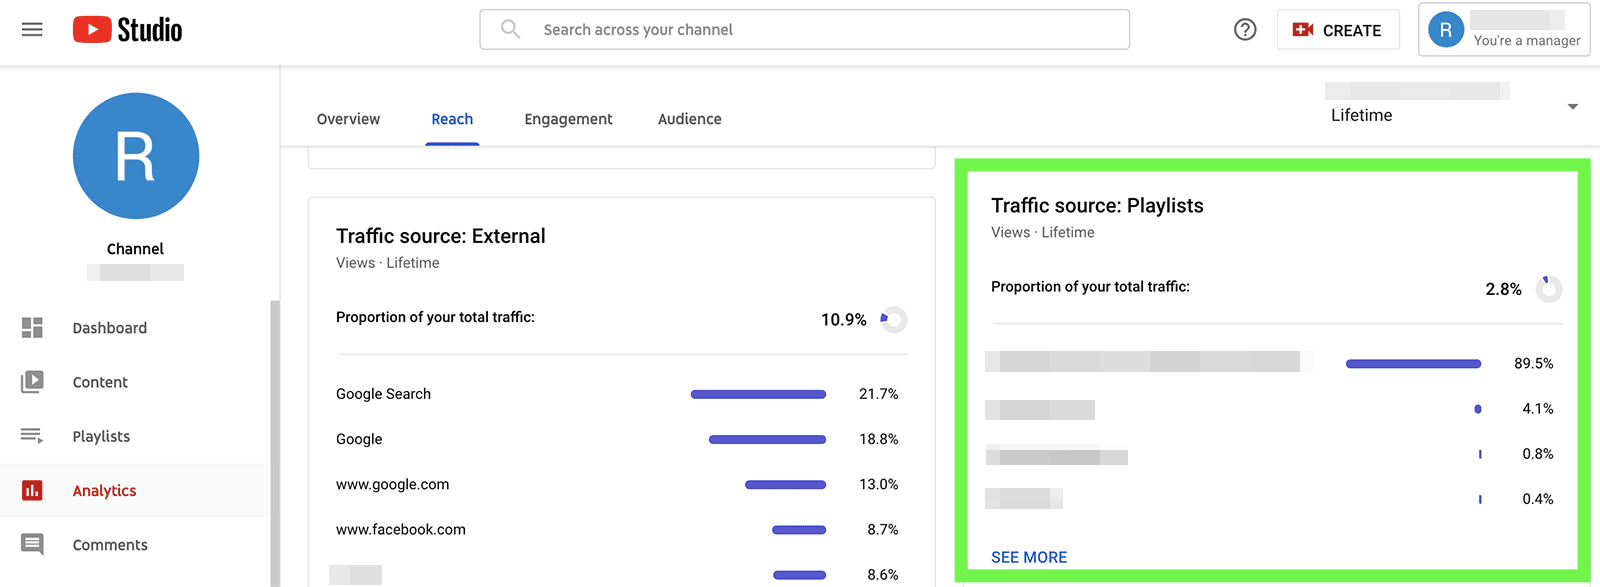
When your team wants to organize videos or encourage users to watch similar content, creating YouTube playlists is a smart option. Once you create playlists, you can track the results on the reach tab.
YouTube automatically tracks the proportion of your channel’s total traffic that comes from playlists. Below the total tally, you can see your top-performing playlists, including the percentage of traffic each contributed.
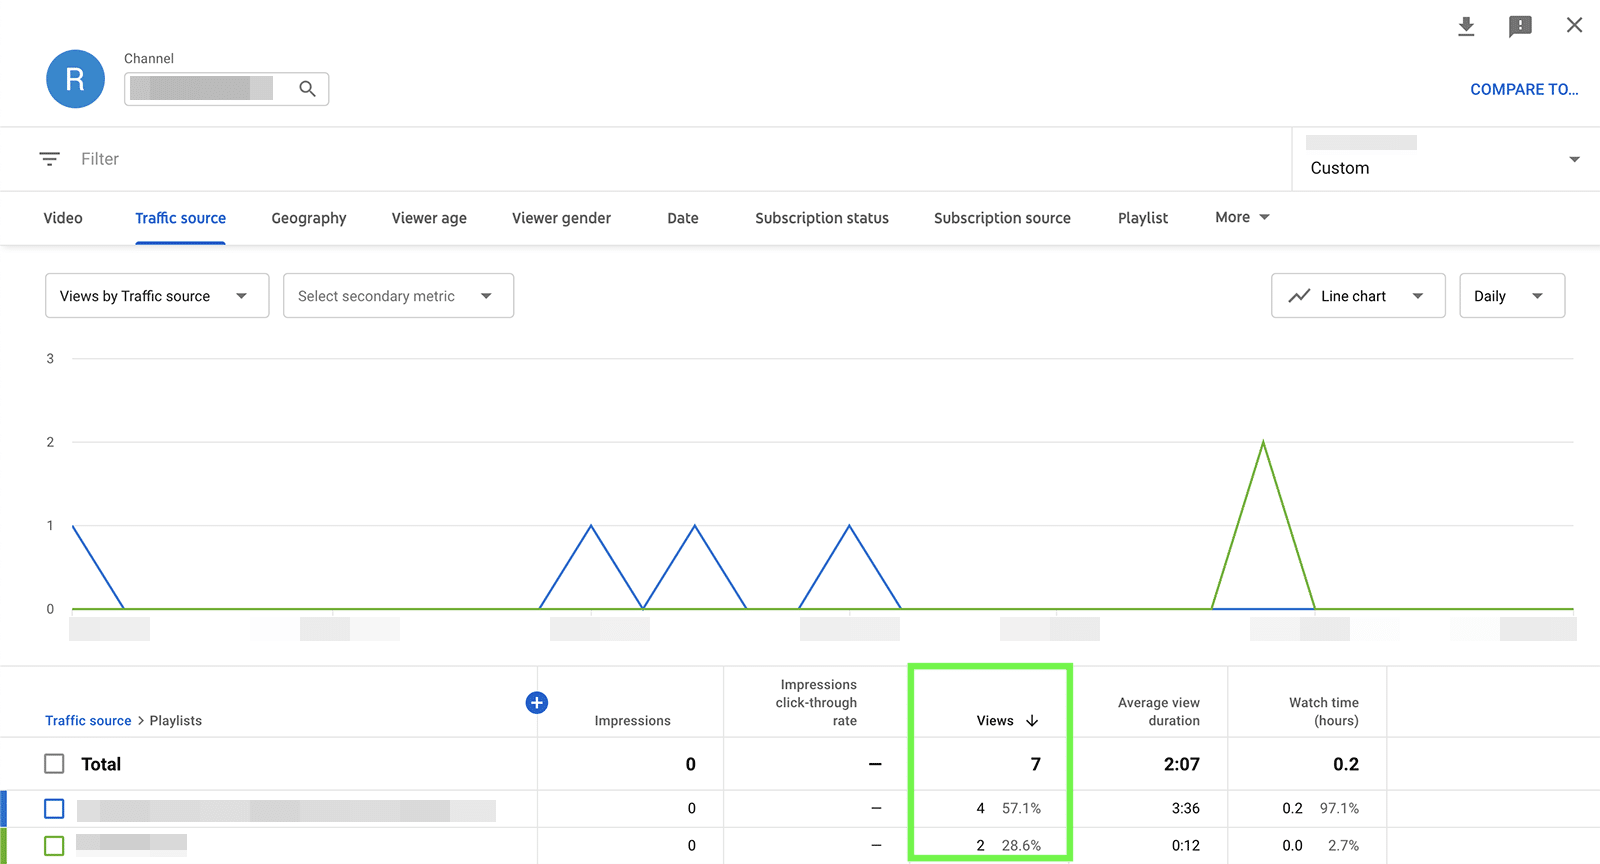
Click to see more and get a closer look at the playlist metrics per video. You can zero in on a single playlist or view them all to see how they all compare or look for patterns.
Top Users
Engaging with and responding to user comments is a great way to connect with viewers and build relationships with your channel’s audience. If you use Agorapulse to manage YouTube comments, then it’s easy to track your most engaged subscribers.
In your Agorapulse dashboard, navigate to the Fans & Followers panel, where you can see a list of the users who comment on your videos the most. The dashboard displays the total number of comments the user has made, so it’s easy to gauge engagement levels quickly.
To track your channel’s most valuable viewers, click on any entry and add the user to your favorites. You can also add custom labels or leave internal notes for your team.
Social Listening
When you want to stay ahead of the competition and ensure that your team reaches its marketing goals, you need to keep an eye on what other brands are doing on YouTube. Even if you have a relatively small niche, staying on top of new content isn’t easy. After all, creators upload over 500 hours of new content to YouTube every hour.
Agorapulse’s social listening dashboard
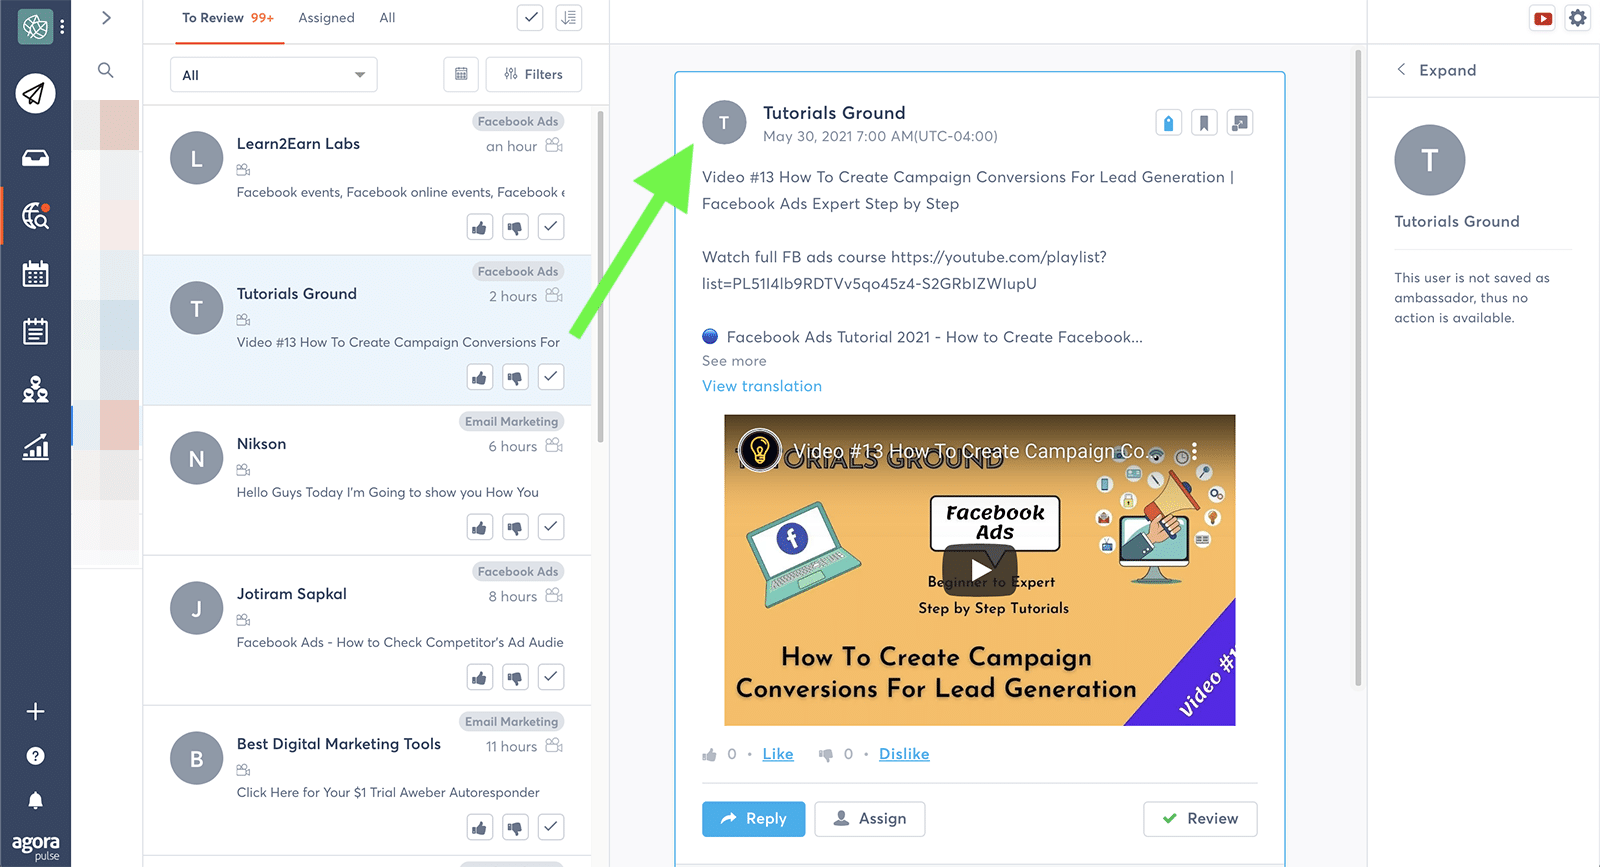
Fortunately, your team can streamline the process by using Agorapulse’s social listening dashboard. Start by creating searches for the channels and keywords you want to monitor. Then check your social listening inbox for the results.
You can click on any inbox item to read the full YouTube description or view the complete video. You can also like and comment on videos right in the inbox.
If you’ve saved the creator as one of your channel’s ambassadors, you can click to view all previous interactions or navigate directly to their profile in your Fans & Followers dashboard.
Tips for Agencies
If your agency manages several YouTube channels, then it’s even more important to monitor metrics efficiently. Use these tips to keep your team on track:
Design reusable client report templates
Although the exporting options for YouTube analytics are limited to spreadsheets (minus the charts), you can create a workaround.
First, create report templates that highlight the YouTube metrics that matter to your team and clients. Then download the data to your team’s Google Sheets account and plug it into reporting templates for your clients.
Filter social listening searches
Avoid filling your social listening inbox with junk mail. When you create a new search in Agorapulse, enter the terms you don’t want to see in addition to the keywords you do want to monitor. You’ll curate your inbox better and be able to focus more on what matters.
Take full advantage of your social CRM
It’s impossible to remember all the users who interact with client content, so let Agorapulse’s social CRM do the work for your team. Be liberal with the labels so your team members know exactly who’s who.
For example, you can label current customers, qualified prospects, or potential influencer partners and prioritize interactions appropriately.
In Conclusion
Whether you run a brand channel or you manage multiple client channels for your agency, you need to identify and monitor the social media metrics that matter to your team.
Once you start collecting data, you can analyze your results, track progress, and optimize your videos, so you can get the best possible ROI.
Take control of your social media right now! Check out our free trial of Agorapulse to help you schedule, track, and measure all your social media efforts.
